Figures & data
Figure 1 MRI scans. (A) and (C) show the cervical lesion and the left pelvic wall metastatic lymph node before treatment, respectively; (B) and (D) show the cervix and the left pelvic wall lymph node after treatment, respectively.
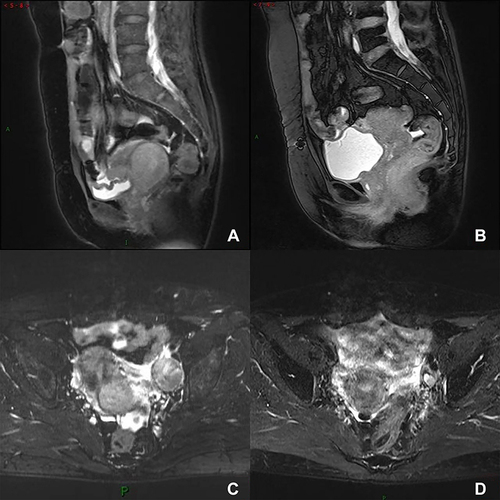
Figure 2 PET/CT image of the soft tissue shadow with increased SUV in the left maxillary sinus.
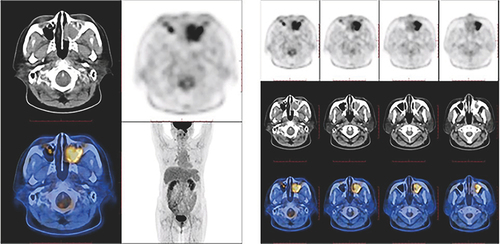
Figure 3 MRI image taken before the first sinus tumor resection.
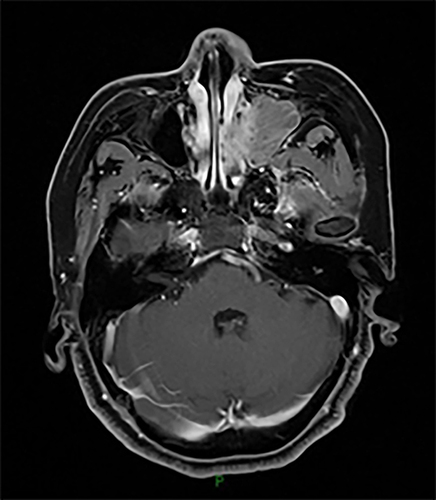
Figure 4 (A) (HE staining, ×10) and (B) (HE staining, ×5) are the first postoperative images revealing a Schneiderian papilloma; (C) (HE staining, ×10) and (D) (HE staining, ×20) are the second postoperative images revealing a Schneiderian papilloma that exhibited papilloma-like hyperplasia.
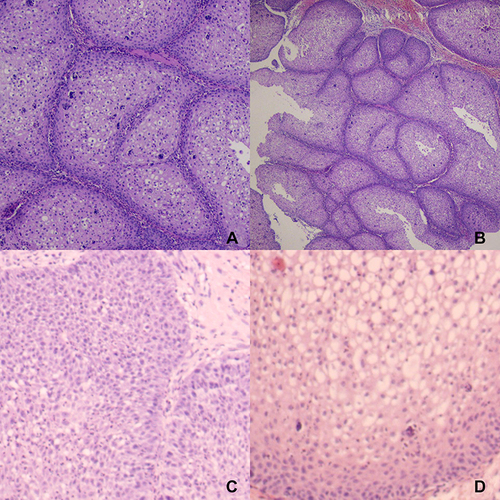
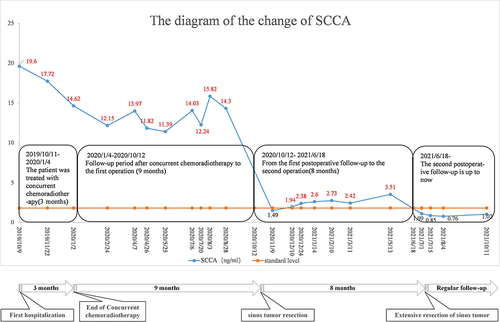
Figure 5 The changes, treatment, and timeline of SCCA assessment throughout the course of the disease. The quantitative results for SCCA shown in red are higher than normal (SCCA normal range 0–1.8ng/ mL). The patient underwent sinus tumor resection on October 12, 2020, and an enlarged sinus tumor resection on June 18, 2021.
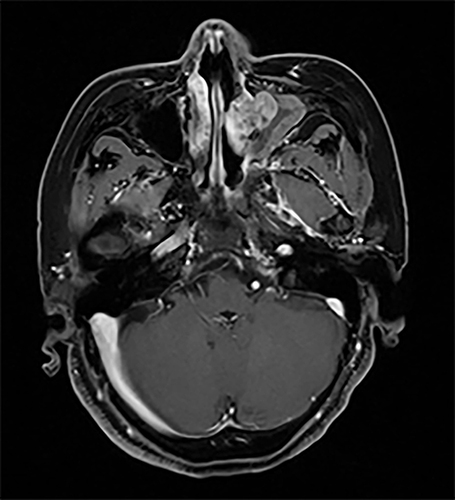
Figure 6 MRI image taken before the second sinus tumor resection.