Figures & data
Figure 1 Preterm birth rate in the United States over time. Adapted from March of Dimes full report card; 2022. Available from: https://www.marchofdimes.org/peristats/data?top=3&lev=1&stop=60®=99&obj=1&slev=1.Citation12
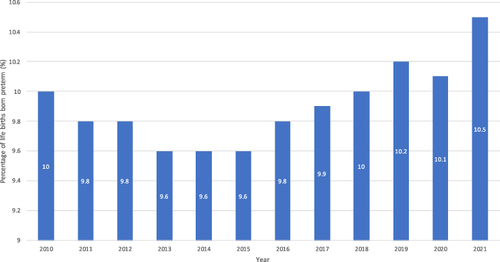
Figure 2 OE- and LMP- based measures of gestational age for selected weeks: United States, 2013.
Notes: OE is the obstetric estimate of the newborn; LMP is the date of the mother’s last normal menses. Reprinted from Martin JA, Osterman MJ, Kirmeyer SE, Gregory EC. Measuring Gestational Age in Vital Statistics Data: transitioning to the Obstetric Estimate. Natl Vital Stat Rep. 2015;64(5):1–20. Source: CDC.Citation15
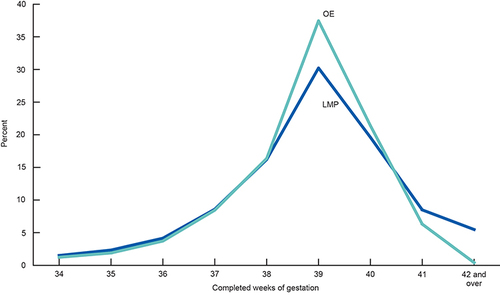
Figure 3 Proposed mechanisms of disease implicated in spontaneous preterm labor. Created with BioRender.com.
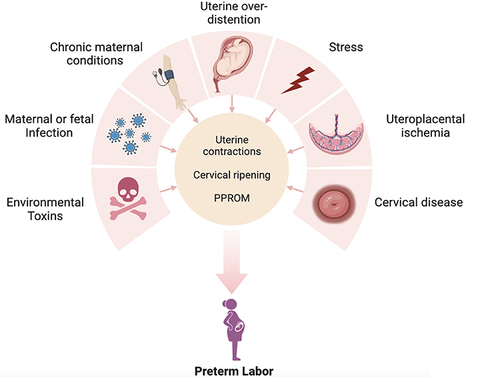
Figure 4 Clinical timeline of 17OHP-C trials and FDA decisions.
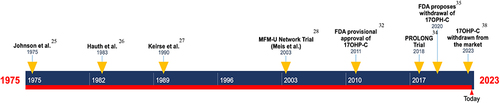
Figure 5 The PROLONG trial examining 5 demographic and baseline characteristics. Data from Nyugen CP.Citation35
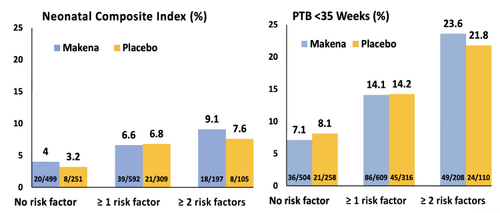
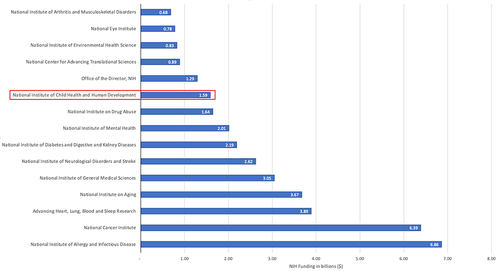
Figure 6 NIH funding allocation in 2022.
Notes: The red rectangle highlights the NIH funding allocated to the National Institute of Child Health and Human Development in 2022. Adapted from NIH Reporter. Fiscal year 2022. Available from: https://reporter.nih.gov/search/fUY0rBAOHUmfky5HZooIlw/projects/charts. Citation73