Figures & data
Table 1 Summary of pivotal SMART trials
Figure 1 SMART-2 trial: mean daily number of hot flushes with up to 12 weeks of treatment with BZA/CE or placebo for the MITT population using LOCF. Statistical significance (P < 0.01) was achieved for BZA 20 mg/CE 0.45 mg during weeks 3 through 12 compared with placebo. At week 2 through 12, the mean daily number of hot flushes with BZA 20 mg/CE 0.625 mg was statistically significant (P < 0.01) from placebo. *P-value vs placebo <0.001.
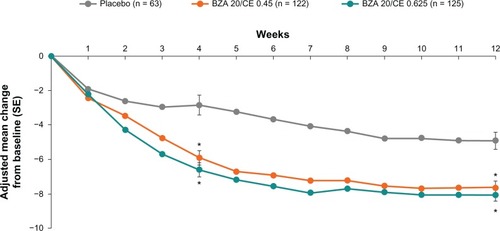
Figure 2 SMART-2 trial: mean daily severity score of hot flushes with up to 12 weeks of treatment with BZA/CE or placebo for the MITT population using LOCF. The mean daily severity score of hot flushes was statistically significant (P < 0.001) for both BZA/CE doses during weeks 3 through 12 compared with placebo. The mean daily severity score was calculated by summing the number of mild, moderate, and severe hot flushes multiplied by 1, 2, and 3, respectively, divided by the total number of hot flushes. *P-value vs placebo <0.001.
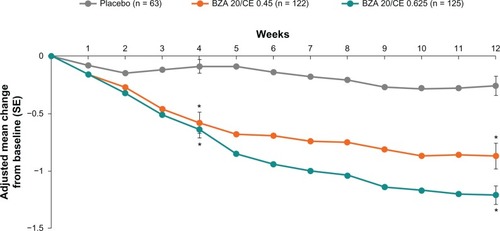
Figure 3 SMART-2 trial: mean change from baseline in the Medical Outcomes Study sleep scale at week 12, MITT population using observed case. BZA/CE improved sleep parameters as measured using this scale. *P-value vs placebo <0.001; **P-value vs placebo 0.051; ***P-value vs placebo 0.010.
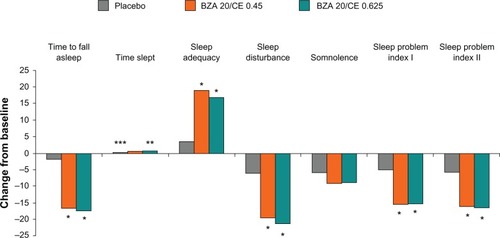
Figure 4 SMART-3 trial: effect of BZA/CE on measurements of vulvovaginal atrophy. (A) Median change from baseline in percentage of vaginal superficial cells at weeks 4 and 12 for treatment with BZA/CE, BZA, or placebo for the MITT population using LOCF. BZA 20 mg/CE 0.625 mg and CE 0.45 mg significantly increased superficial cells at week 4 (P = 0.0034 and P < 0.001) and week 12 (P < 0.001 for both doses) over placebo and BZA using nonparametric analyses. *P-value vs placebo <0.001. (B) Median change from baseline in percentage of vaginal parabasal cells at weeks 4 and 12 for treatment with BZA/CE, BZA, or placebo for the MITT population using LOCF. BZA 20 mg/CE 0.625 mg and CE 0.45 mg significantly decreased superficial cells at week 4 and week 12 (P < 0.001 for both doses) over placebo and BZA using nonparametric analyses. *P-value vs placebo <0.001. (C) Mean change from baseline in vaginal pH at weeks 4 and 12 for treatment with BZA/CE, BZA, or placebo for the MITT population using LOCF. BZA 20 mg/CE 0.625 but not BZA 20 mg/CE 0.45 mg significantly decreased vaginal pH at week 4 and week 12 (P < 0.001) over placebo. *P-value vs placebo <0.001. (D) Percentage of women with MBS data by severity at week 12. MBS significantly improved with BZA 20 mg/CE 0.625 mg compared with placebo and BZA alone at week 12 (P < 0.05). *P-value = 0.048.
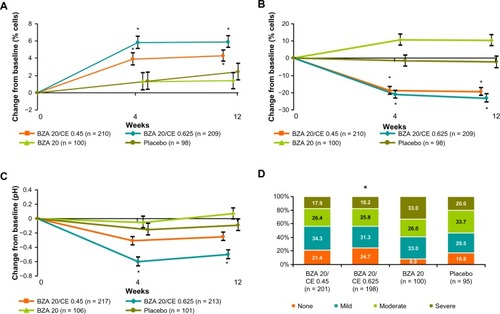
Figure 5 SMART-1 trial: Adjusted mean percent change in BMD from baseline to months 6, 12, 18, and 24 from the MITT population using LOCF. BZA/CE increased bone mineral density at the lumbar spine as compared with placebo and baseline values (P < 0.01) and raloxifene 60 mg (P < 0.05 BZA/CE). P-value vs placebo ≤0.001 (all BZA/CE groups at 6, 12, 18 and 24 m); P-value versus baseline ≤0.001 (all BZA/CE groups at 6, 12, 18 and 24 m); *P-value versus RAL ≤ 0.05 at 6, 12, 18 and 24 m.
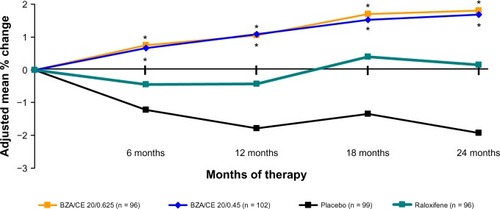
Figure 6 SMART-5 trial: Percentage (standard error) of subjects with amenorrhea during cycles 1–13 (MITT population) for each treatment group. BZA/CE (both doses), BZA, and placebo demonstrated a similar incidence of cumulative amenorrhea for all cycles. CE/MPA showed a significantly lower amenorrhea rate (P < 0.001 versus all other treatment groups). No difference between any Bazedoxifene/CE group and placebo. *P < 0.001 vs placebo.
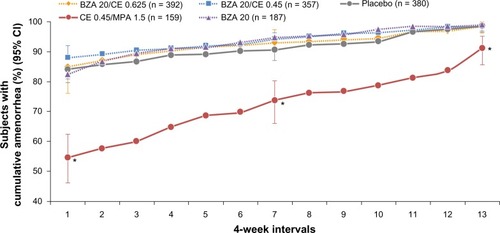
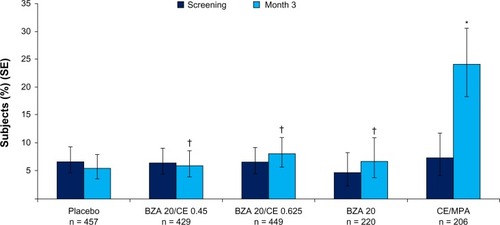
Figure 7 Percentage of women reporting one or more days of breast tenderness at week 12. BZA/CE (both doses), BZA, and placebo demonstrated similar incidences of breast tenderness. CE/MPA showed a significantly higher rates (P < 0.001 versus all other treatment groups). *P < 0.001 vs placebo; †P < 0.001 vs CE/MPA. No difference between any Bazedoxifene/CE group and placebo at 9–12 wks.