
Figures & data
Table 1 Baseline Characteristic (n)
Figure 1 Consort flow diagram.
Notes: CONSORT figure adapted from Schulz KF, Altman DG, Moher D. CONSORT 2010 Statement: Updated Guidelines for Reporting Parallel Group Randomised Trials. PLoS Med. 2010;7(3): e1000251. Copyright: © 2010 Schulz et al. Creative Commons Attribution License.Citation12
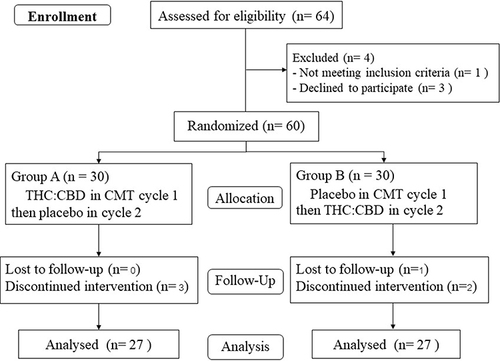
Table 2 Mean Nausea Score Between THC:CBD and Placebo Groups
Figure 2 Mean nausea score between group A and B.
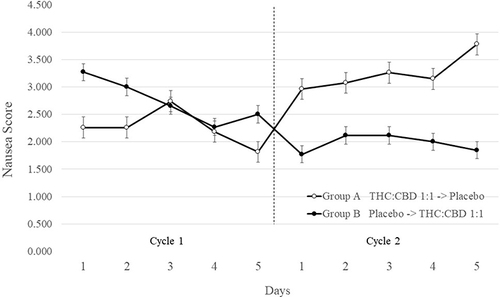
Table 3 Side-Effects Between THC:CBD 1:1 and Placebo (N = 54)
Table 4 Summarized Data from Previous Literature of Cannabinoid Extract and Chemotherapy in Chemotherapy-Induced Nausea and Vomiting (CINV) Aspects