
Figures & data
Table 1 Characteristics of the Participants (n=210)
Table 2 EFA Factor Loadings for the SRQ-20
Figure 1 ROC curve of the SRQ-20.
Abbreviations: ROC, receiver operating characteristic; AUC, area under the curve.
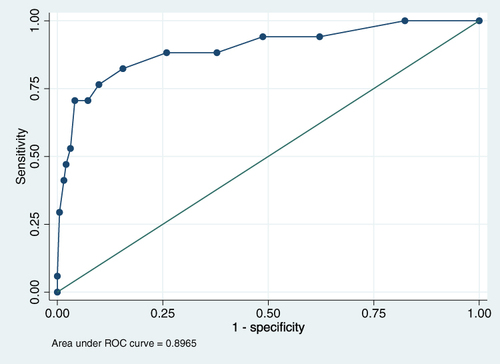
Table 3 Sensitivity, Specificity, and Proportion Correctly Classified at Different Cut-off Scores of the SRQ-20