Figures & data
Table 1 Primer Sequences for Real-Time PCR Used in the Study
Figure 1 Expression level of the prognostic value in normal tissues and breast cancer samples from the TCGA Database. (A) EPHA2, (B) PIK3R1, (C) CTNNB1, (D) PECAM1.
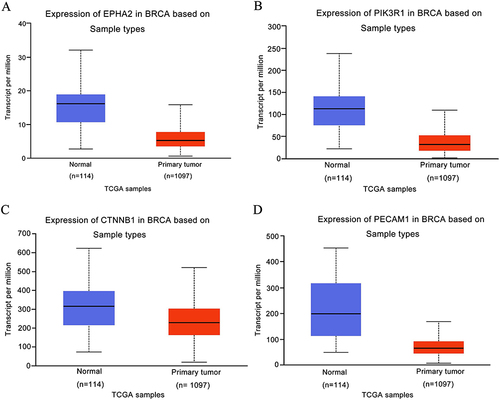
Figure 2 Survival curves comparing low and high expressions of EphA2/PIK3R1/CTNNB1/PECAM1 in breast cancer. (A) EPHA2, (B) PIK3R1, (C) CTNNB1, (D) PECAM1. All the survival analyses were conducted via Kaplan–Meier Plotter database (https://kmplot.com/analysis).
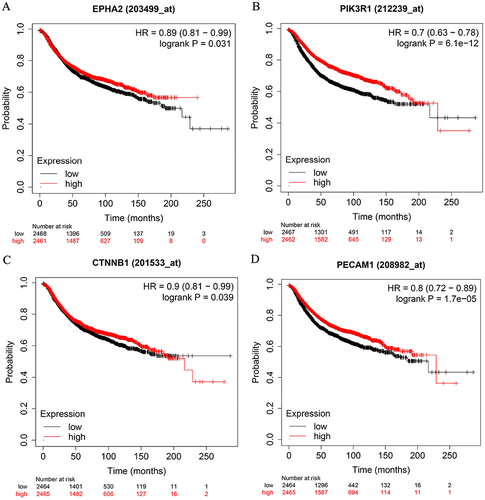
Figure 3 Expression level and correlation analysis of studied genes in breast cancer tissue. (A–C) mRNA expression of EphA2/PIK3R1/CTNNB1 by qRT-PCR assay, n=20, *Denotes P<0.05 compared with paracancerous group. (D–F) Pearson correlation analysis of EphA2/PIK3R1/CTNNB1/ PECAM1 in breast cancer samples from TCGA database. (G) The correlation of EPHA2 and PIK3R1 in breast cancer samples, n=20, R2=0.4257, P =0.0018. (H) The correlation of PIK3R1and CTNNB1 in breast cancer samples, n=20, R2=0.2215, P =0.0362. (I) The correlation of EPHA2 and CTNNB1 in breast cancer samples, n=20, R2=0.2279, P =0.0333.
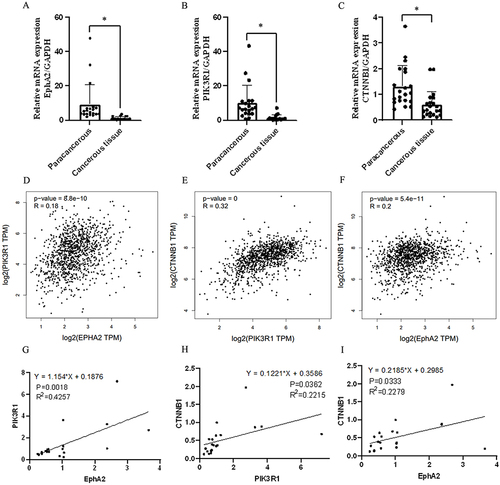
Figure 4 Immunohistochemical staining of studied genes in para-carcinoma and breast cancer tissues. (A) Expression intensity and location of EphA2 in para-carcinoma tissue and breast cancer tissue by immunohistochemical staining assay. (B) Quantitative analysis of EphA2 from immunohistochemical images by histochemical scores. (C) Expression intensity and location of PIK3R1 in para-carcinoma tissue and breast cancer tissue by immunohistochemical staining assay. (D) Quantitative analysis of PIK3R1 from immunohistochemical images by histochemical scores. (E) Expression intensity and location of CTNNB1 in para-carcinoma tissue and breast cancer tissue by Immunohistochemical staining assay. (F) Quantitative analysis of CTNNB1 from immunohistochemical images by histochemical scores. n=20, *Denotes P<0.05 compared with paracancerous group.
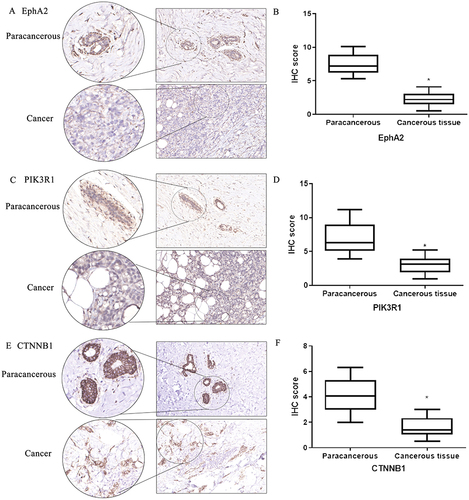
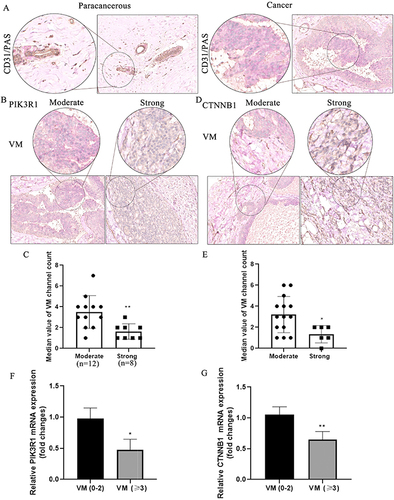
Figure 5 The correlation of vascular mimicry and PIK3R1/CTNNB1 in breast cancer. (A) vasculogenic mimicry exists in paracancerous and breast cancer tissues. (B) VM in moderate and strong expression of PIK3R1 in cancer tissues. (C) Quantitative analysis of VM channel in moderate and strong expression of PIK3R1, **Denotes P<0.01 compared with moderate group. (D) VM in moderate and strong expression of CTNNB1 in cancer tissues. (E) Quantitative analysis of VM channel in moderate and strong expression of CTNNB1, *Denotes P<0.05 compared with moderate group. (F and G) Expression of PIK3R1 and CTNNB1 in different VM channels by qRT-PCR assay. *And **Denote P<0.05 and P<0.01 compared with VM (0–2) group.