Figures & data
Table 1 Comparison Sociodemographic Characteristics, FGM/C-Related Characteristics and FGM/C Complications of Participants According to Groups (n = 508)
Table 2 Comparison of the Distributions of Participants’ FGM/C Intention for Their Daughters, FGM-Related Complications, and Characteristics of FGM/C Practice
Table 3 Comparison of Having FGM/C, Positive Perception for Their FGM/C and Intention to FGM/C for Her Child
Table 4 Comparison of Participants’ Self-FGM/C Status and Perception with FGM/C According to Characteristics of Participants
Table 5 Comparison of the FGM/C Status of the Participants’ Daughters and Their Intention to Allow Their Daughters to Undergo FGM/C, and Their Sociodemographic Characteristics
Figure 1 Views of participants on FGM/C (n = 508).
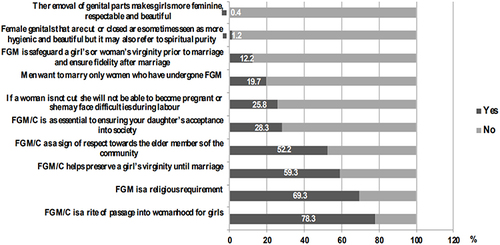
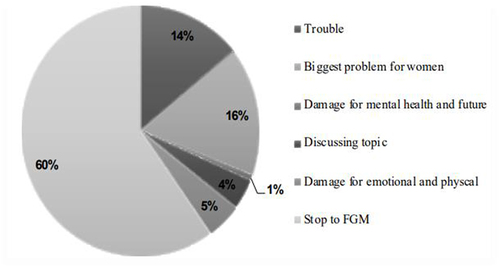
Figure 2 Message of participants on FGM/C (n = 127).