Figures & data
Table 1 Comparisons of the Characteristics of the Study Population
Figure 1 Study flowchart for inclusion of study participants.
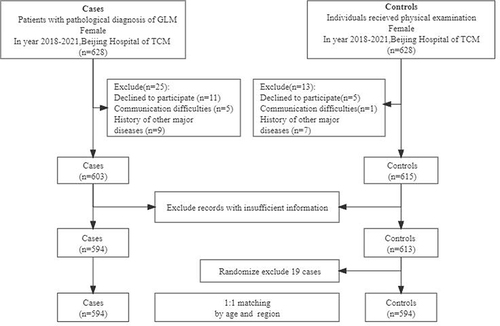
Figure 2 Comparisons of study groups by age (A) and age of the youngest child (B).
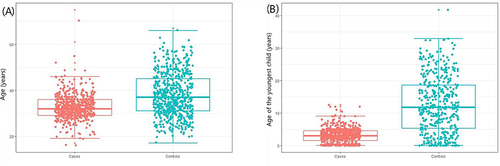
Table 2 Comparisons of Personal History Between the Case and Control Groups
Table 3 Comparisons of Hormone-Related Factors Between the Case and Control Groups
Table 4 Comparisons of Exogenous Factors Between Case and Control Groups
Table 5 Comparisons of Emotional and Other Factors Between the Case and Control Groups
Table 6 Multivariable Logistic Regression Analysis of the Risk and Protective Factors of GLM
Figure 3 Forest plot of binary conditional logistic regression analysis of risk factors of GLM.
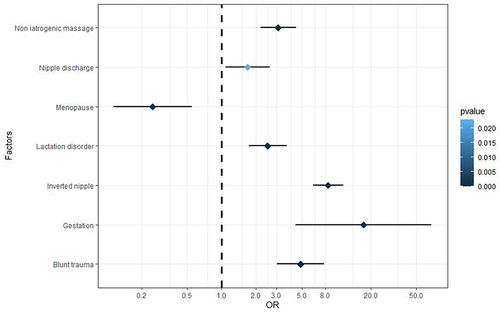
Figure 4 Receiver operating characteristic (ROC) curve of the predisposing factors of GLM.
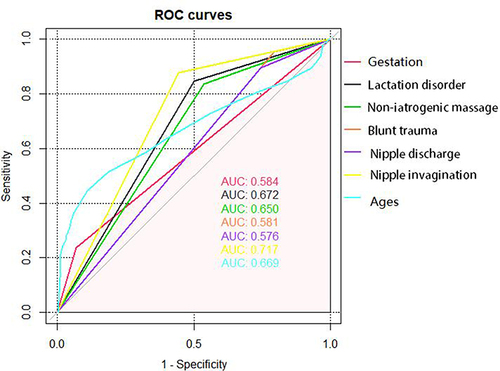
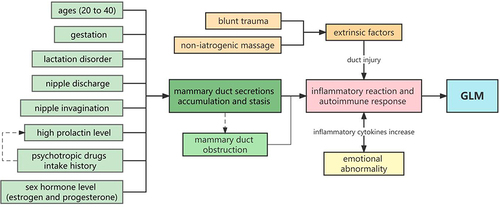
Figure 5 Diagram of GLM predisposing factors.