Figures & data
Table 1 Patient Attrition
Table 2 Patient Demographic and Clinical Characteristics at Index
Figure 1 Patient Treatment Patterns Through 24 Months.
Abbreviation: UF, uterine fibroid.
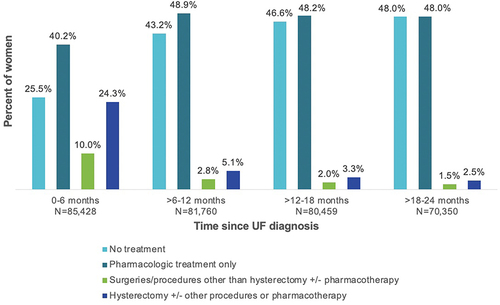
Figure 2 UF-related Pharmacotherapy Use Before and After Initial UF Diagnosis.
Abbreviations: GnRH, gonadotropin-releasing hormone; NSAID, non-steroidal anti-inflammatory drug; UF, uterine fibroid.
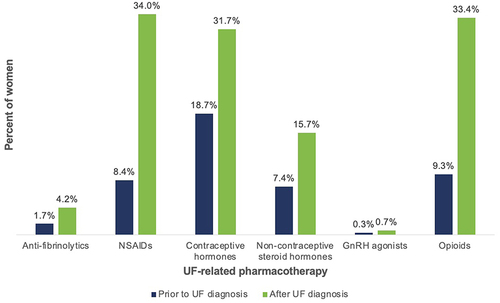
Table 3 Mean Time (Days) on Post-Index Contraceptive Hormone Therapy
Table 4 Subsequent Therapies Received by Patients Who Discontinued Initial Post-Index Contraceptive Hormones
Figure 3 KM Analysis of Time to Hysterectomy.
Notes: Start of analysis is the study index date for all patients, pts with prior procedures, and pts without prior procedures. Pts with prior procedures = subgroup of patients who had a pre-index surgical procedure; Pts without prior procedures = subgroup of patients who did not have a pre-index surgical procedure.
Abbreviation: pt, patient.
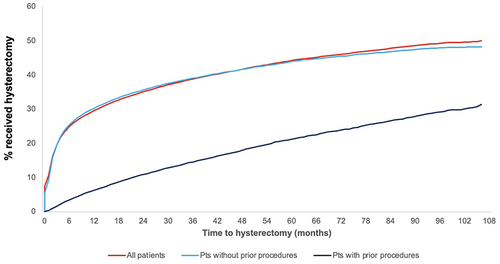
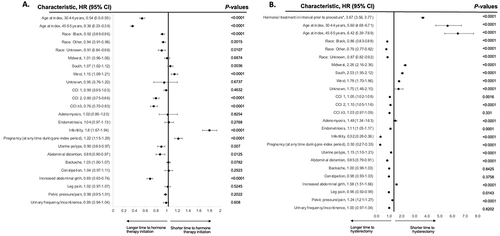
Figure 4 Forest Plot of Multivariate Cox Proportional Hazards Model, Time to (A) Initiation of Hormonal Therapy and (B) Hysterectomy. *Measured during 6-month intervals post-UF diagnosis.
Notes: For time to initiation of hormone therapy, 66,656 patients were included in the final model; 18,772 were excluded because they had prior hormone therapy before the UF diagnosis date. References: Age, 18–29 years; Race, White; Geographic region, Northeast; CCI, 0; Comorbidities, absence of each respective comorbidity; Bulk symptoms, absence of each respective bulk symptom.
Abbreviations: CCI, Charlson Comorbidity Index; CI, confidence interval; HR, hazard ratio.