
Figures & data
Figure 1 Illustration of E2 change during controlled ovarian hyperstimulation in control and E2 decline group.
Note: This image describes the different trends of E2 change in our test and control groups during controlled ovarian hyperstimulation.
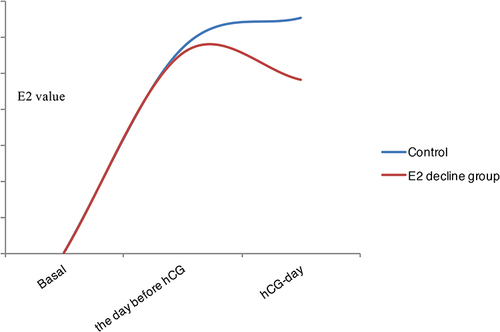
Table 1 Demographics and Cycle Parameters of the E2 Decline Group and Control Group
Table 2 IVF and Clinical Outcomes of the E2 Decline Group and Control Group
Table 3 Demographics and Cycle Parameters of the E2 Decline Group and Control Group Without Pretreatment of Oral Contraceptive (OC) and with Pretreatment of Oral Contraceptive (OC)
Table 4 IVF and Clinical Outcomes of the E2 Decline Group and Control Group Without Pretreatment of Oral Contraceptive (OC) and with Pretreatment of Oral Contraceptive (OC)