Figures & data
Figure 1 Causal impact analysis of the COVID-19 pandemic on total births in the Federal District public health system adjusted to the Federal District population over time using data from March 2018 to February 2022. The first panel shows the observed births (solid black line), the counterfactual prediction of births if COVID-19 had not occurred adjusted to the Federal District population over time (dotted blue line), and the 95% CI of births of the counterfactual prediction. The second panel shows the difference between observed births and the counterfactual prediction of births, the pointwise causal effect of COVID-19 on births adjusted to the Federal District population over time (dotted blue line). The third panel shows the pointwise contributions from the second panel, resulting in a plot of the cumulative effect of COVID-19 on births (dotted blue line). After the COVID-19 onset in Brazil in March 2020 (dotted gray vertical line), the 95% CI of the cumulative effect of COVID-19 on births includes the counterfactual prediction of cumulative deliveries (x-axis baseline) almost over time and at the end of the follow-up, meaning that it does not deviate significantly from the counterfactual prediction by the model.
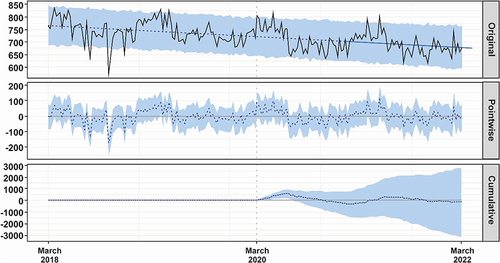
Figure 2 Vaginal deliveries, c-sections, and total births in the Federal District public health system annually from March 2018 to February 2022 (n = 150,617). Cochran-Armitage test for trend in proportions: p-value < 0.01.
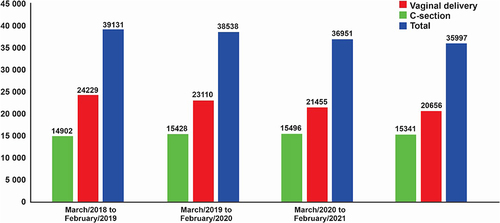
Figure 3 Causal impact analysis of the COVID-19 pandemic on c-sections performed in the Federal District public health system adjusted to the total births over time using data from March 2018 to February 2022. The first panel shows the observed c-sections (solid black line), the counterfactual prediction of c-sections if COVID-19 had not occurred adjusted to the total births over time (dotted blue line), and the 95% CI of the counterfactual prediction of c-sections. The second panel shows the difference between observed c-sections and the counterfactual prediction of c-sections, the pointwise causal effect of COVID-19 on c-sections adjusted to total births over time (dotted blue line). The third panel shows the pointwise contributions from the second panel, resulting in a plot of the cumulative effect of COVID-19 on c-sections (dotted blue line). After the COVID-19 onset in Brazil in March 2020 (dotted gray vertical line), the 95% CI of the cumulative effect of COVID-19 on c-sections (shaded region) moves above the counterfactual prediction of cumulative births (x-axis baseline) over time and deviates significantly at the end of the follow-up from the counterfactual prediction by the model.
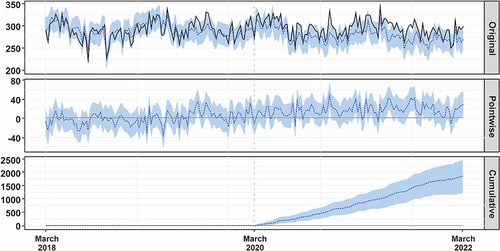
Table 1 Multivariate Analysis of Variables Associated with Maternal Mortality
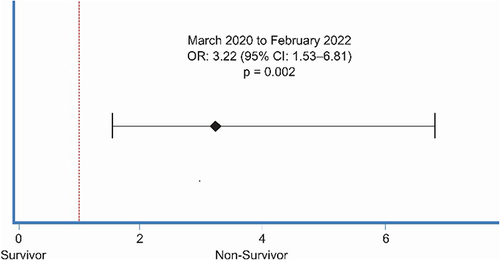
Figure 4 Effect of the post-COVID period (March 2020 to February 2020) on maternal mortality in maternity after propensity score-matching adjusted to c-section and age.