
Figures & data
Figure 1 Schematic of study methods. COVID-19, coronavirus disease 2019.
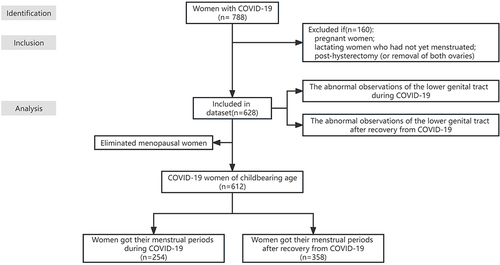
Table 1 Demographic Characteristics of Child-Bearing Age Women with COVID-19
Table 2 Cross Tabulation of COVID-19 Infection Symptoms, Duration of Symptoms, Treatment, Mood Changes Following COVID-19 Infection and Time of Menstruation When COVID-19 Symptoms First Appeared
Figure 2 The proportion of changes in menstruation during COVID-19 infection.
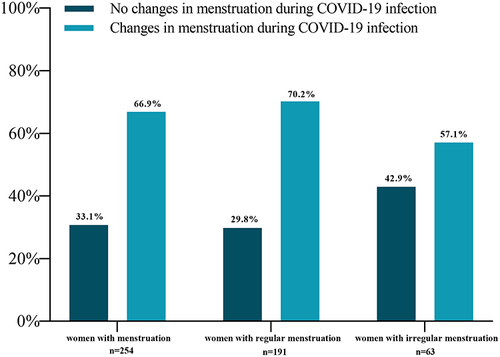
Figure 3 (A) Menstrual changes during COVID-19 Infection (menstrual cycle length, period duration and menstrual flow). (B) No significant changes in dysmenorrhea and non-menstrual bleeding during COVID-19. (C) Risk factors influencing menstrual changes during COVID-19 infection.
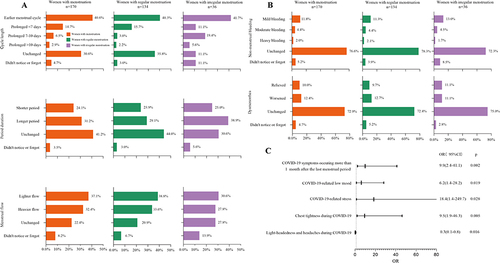
Table 3 Comparison of Participant’s Responses About the Effect of COVID-19 on Menstruation During COVID-19 Infection and After Recovery from COVID-19
Figure 4 Trends in menstrual changes during COVID-19 infection and after recovery from COVID-19.
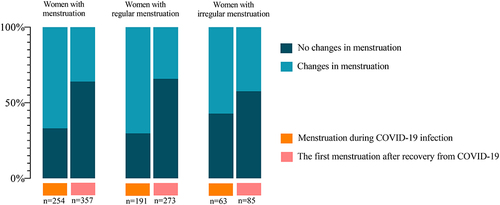
Figure 5 (A) Abnormality observed in lower genital tract during COVID-19 infection. (B) The risk factors contributing to the predominant abnormal observation of the lower genital tract during COVID-19 infection, estimated from the binary logistic regression.
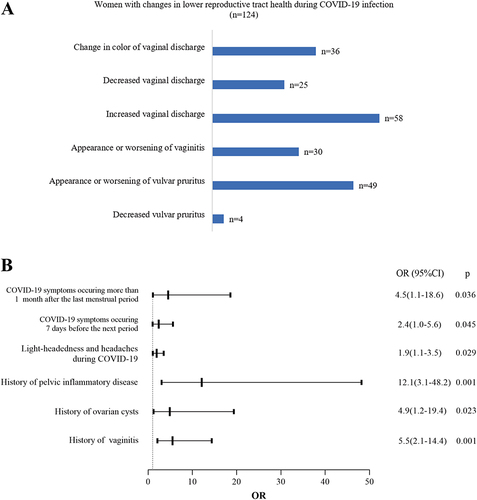
Table 4 Time Required for Lower Reproductive Tract to Return to Pre-Infection in Women with Abnormal Lower Reproductive Tract Observations After COVID-19 Negativity (n=34)