
Figures & data
Figure 1 Schematic presentation of the sampling procedure at selected hospitals of Northwest Ethiopia, 2023.
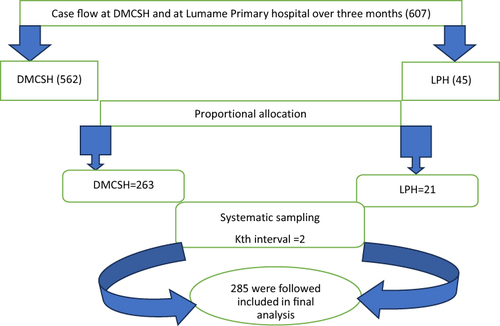
Table 1 Socio-Demographic Characteristics of Women Undergoing Emergency Cesarean Delivery at Selected Hospitals of Northwest Ethiopia, 2023 (n=285)
Table 2 Obstetrical Characteristics of Women Undergoing Emergency Cesarean Delivery at Selected Hospitals of Northwest Ethiopia, 2022/23 (n=285)
Figure 2 Decision to delivery time among women underwent emergency cesarean delivery with different indications at selected hospitals of Northwest Ethiopia, 2023.
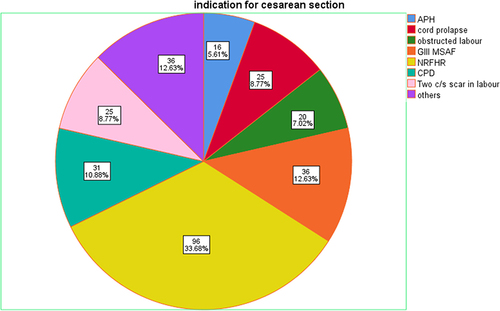
Figure 3 Decision to delivery time among women who underwent emergency with the rank of surgeon at selected hospitals of Northwest Ethiopia, 2023.
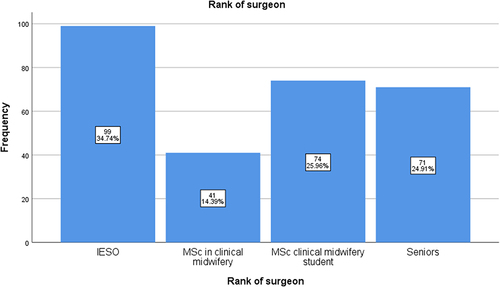
Figure 4 The overall restricted mean decision to delivery time among women who underwent emergency cesarean delivery at selected hospitals of Northwest Ethiopia, 2023.
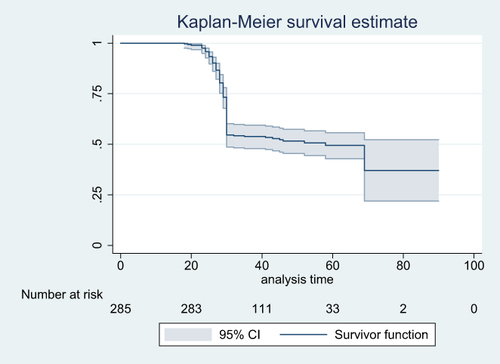
Figure 5 Kaplan–Meier survival curve for comparison of the mean decision to delivery time among women who underwent emergency cesarean delivery with informed consent at selected hospitals of Northwest Ethiopia, 2023.
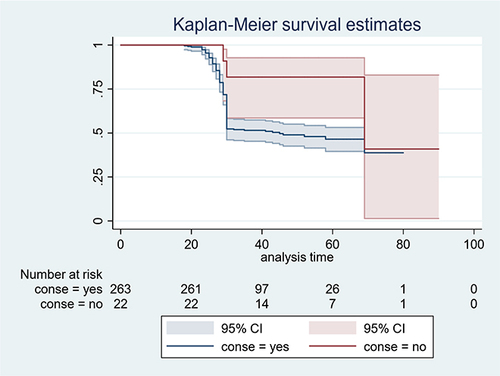
Figure 6 Kaplan–Meier survival curve for comparison of the mean decision to delivery time among women who underwent emergency cesarean delivery with indication at selected hospitals of Northwest Ethiopia, 2023.
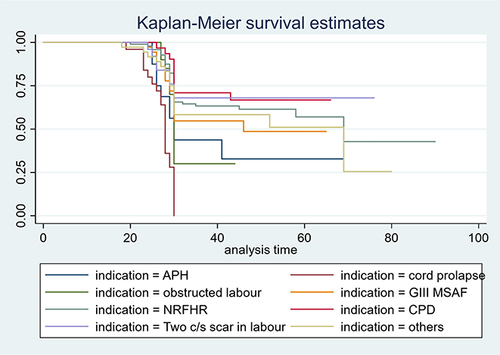
Figure 7 Kaplan–Meier survival curve for comparison of the mean decision to delivery time among women who underwent emergency cesarean delivery with OR material prepared at selected hospitals of Northwest Ethiopia, 2023.
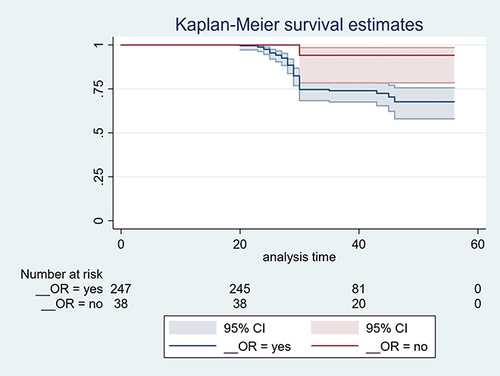
Figure 8 Kaplan–Meier survival curve for comparison of the mean decision to delivery time among women who underwent emergency with free functional OR table present at selected hospitals of Northwest Ethiopia, 2023.
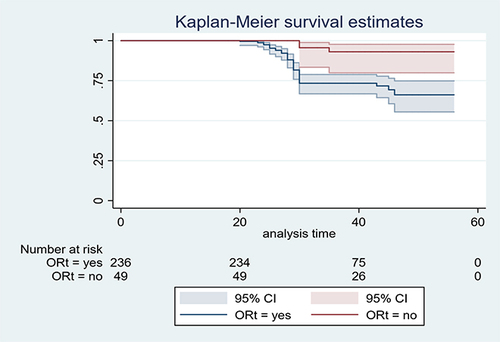
Figure 9 Kaplan–Meier survival curve for comparison of the mean decision to delivery time among women who underwent emergency cesarean delivery with regional anesthesia and general anesthesia at selected hospitals of northwest Ethiopia, 2023.
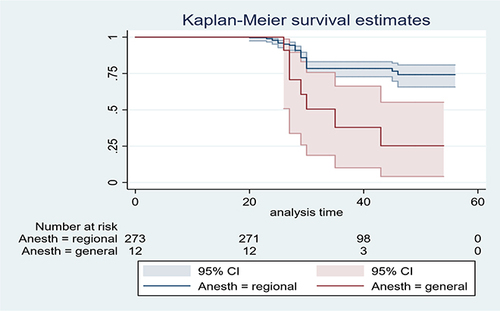
Table 3 Goodness-of-Fit Test Assessing Proportional Hazards Assumption
Table 4 Cox Regression Analysis of Predictors of Decision to Delivery Time Among Women Who Underwent Emergency Cesarean Delivery at Selected Hospitals of Northwest Ethiopia, 2023 (N=285)