
Figures & data
Figure 1 The screen process of the participants.
Abbreviation: SEER, surveillance, epidemiology, and end results.
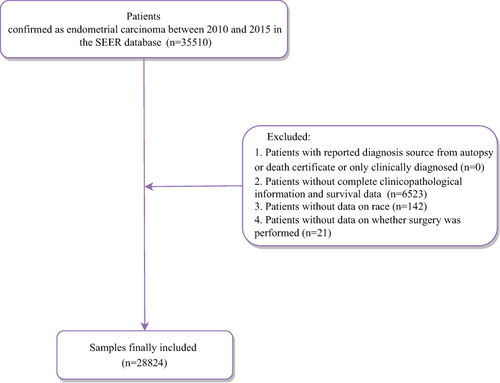
Table 1 Comparisons of the Characteristics of Alive and Dead Patients with Endometrial Carcinoma
Table 2 The Association of Survival of Patients with FIGO Staging
Figure 2 The Kaplan–Meier curve of endometrial carcinoma based on FIGO staging.
Abbreviation: FIGO, The International Federation of Gynecology and Obstetrics.
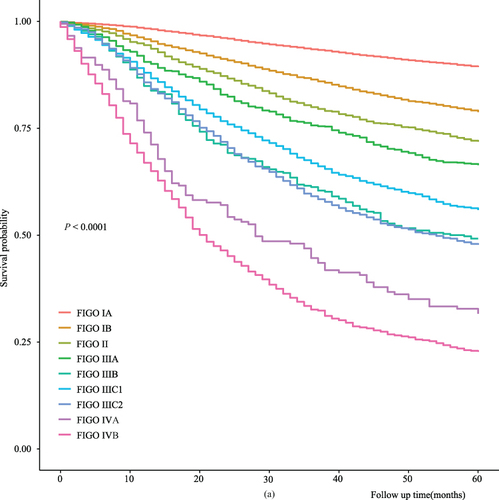
Table 3 Construction of the New Staging System
Table 4 The Association Between the New Staging with the Survival of Patients
Figure 3 The Kaplan–Meier curve of endometrial carcinoma based on new staging before (left) and after (right) combining overlap.
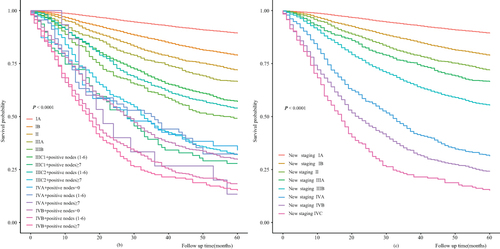
Table 5 Comparisons of the C-Index of FIGO Staging and New Staging
Table 6 Subgroup Analysis of the Survival of Endometrial Carcinoma Patients Using FIGO Staging and New Staging