
Figures & data
Figure 1 Flowchart for screening patients.
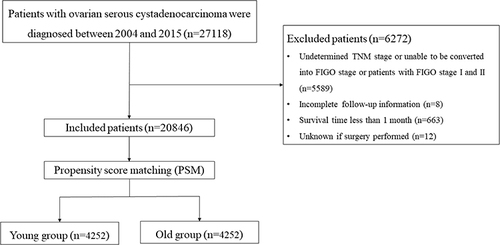
Figure 2 X-Tile analysis of survival data from the SEER database. (A) The X-Tile plot displays red coloration of cut-points, indicating a negative correlation with survival, while green coloration represents a positive correlation. The plot illustrates patient age divided at the mean age, and the optimal cut-point is highlighted by a black circle located in the middle of the color bar. (B) The histogram of the entire cohort reveals that the optimal cut-off value of age at diagnosis is 73 years, based on cancer-specific survival (CSS). The X-axis represents the age of patients, and the Y-axis represents the number of patients at each age. (C) The Kaplan-Meier survival curve is generated based on these cut-off values.
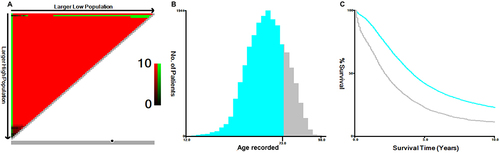
Table 1 Baseline Characteristics of Patients with Advanced Ovarian Serous Cystadenocarcinoma in the SEER Database, n(%)
Table 2 The Cox Hazard Regression Analysis of Overall Survival
Table 3 The Cox Hazard Regression Analysis of Cancer-Specific Survival
Figure 3 Kaplan-Meier curves of overall survival (OS) and cancer-specific survival (CSS). Kaplan-Meier curves of OS (A) and CSS (B) before propensity score matching (PSM), Kaplan-Meier curves of OS (C) and CSS (D) after PSM.
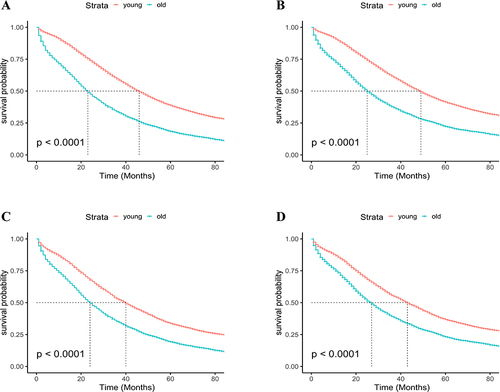
Figure 4 The forest plot of subgroup analyses according to age (young vs old) of patients with advanced serous ovarian cystadenocarcinoma in the PSM cohort from the SEER database.
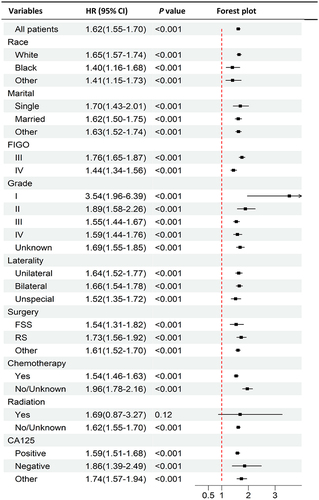
Figure 5 Differentially expressed genes (DEGs) between the old group and the young group. (A) The heatmap of DEGs. (B) The volcano plot of DEGs. (C) A bar chart of Kyoto Encyclopedia of Genes and Genomes (KEGG) enrichment of DEGs. (D) A bar chart of Gene Ontology (GO) analysis of DEGs. (E) The protein-protein interaction network of DEGs.
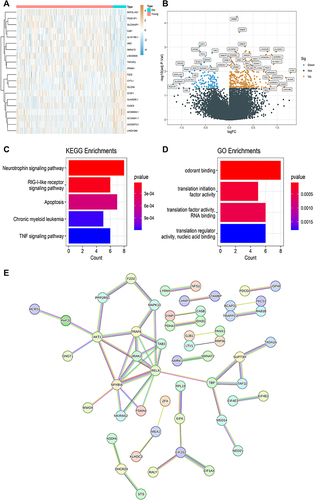
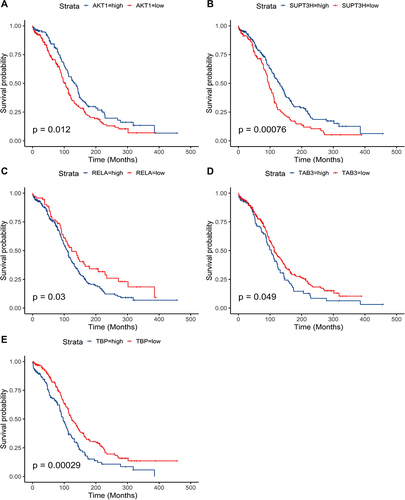
Figure 6 Survival analysis of DEGs. Kaplan-Meier analysis is developed based on the expression levels of AKT1 (A), SUPT3H (B), RELA (C), TAB3 (D), and TBP (E).
Data Sharing Statement
The following information was supplied regarding data availability: Data is available at the SEER database (https://seer.cancer.gov/) and the TCGA database (https://portal.gdc.cancer.gov/).