
Figures & data
Figure 1 Forest plot illustrating the causal relationship between single nucleotide polymorphisms (SNPs) associated with endometriosis and pelvic inflammatory disease (PID) using Inverse Variance Weighting (IVW), MR-Egger, and Weighted Median (WM) analyses. Red lines represent MR results from IVW and MR-Egger.
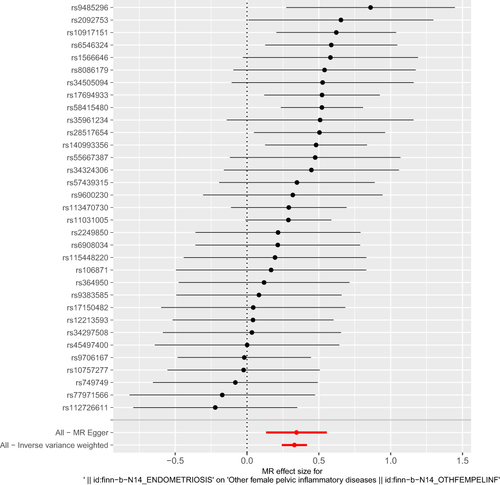
Table 1 Information on Single Nucleotide Polymorphism (SNP) Loci Associated with Endometriosis
Table 2 Evaluation of the Impact of Endometriosis on the Causal Relationship with Pelvic Inflammatory Disease Using Inverse Variance Weighting (IVW), MR-Egger, and Weighted Median (WM) Methods
Figure 2 Scatter plot depicting the genetic associations between endometriosis and pelvic inflammatory disease. Blue represents Inverse Variance Weighting (IVW), dark blue represents MR-Egger, and green represents Weighted Median (WM) analyses.
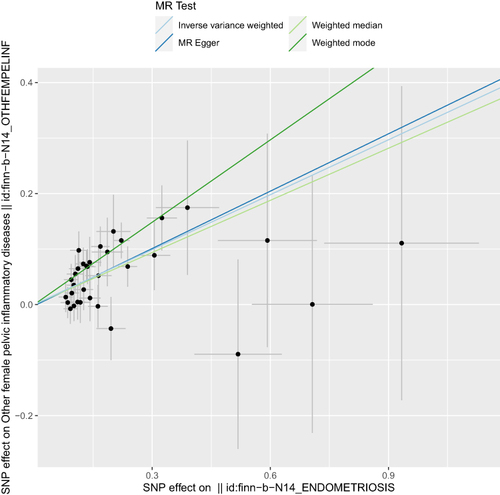
Table 3 Cochran’s Q Assessment of Heterogeneity for Inverse Variance Weighting (IVW) and MR-Egger Results in the Relationship Between Endometriosis and Pelvic Inflammatory Disease
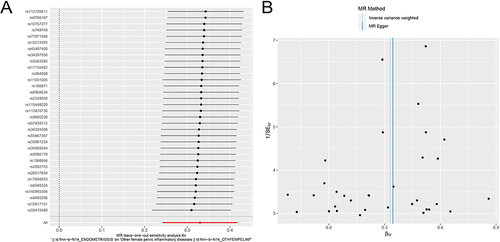
Figure 3 Sensitivity and heterogeneity assessment for the relationship between endometriosis and pelvic inflammatory disease. (A) Forest plot illustrating the impact on pelvic inflammatory disease by sequentially excluding single nucleotide polymorphisms (SNPs). Red dots represent IVW estimates for all SNPs. (B) Funnel plot evaluating heterogeneity, with blue line representing IVW and dark blue line representing MR-Egger.
Data Sharing Statement
The data that support the findings of this study are available from the corresponding author upon reasonable request.