Figures & data
Figure 1 Ultrasonography was performed at 23 weeks of gestation. (a) The placenta was found to be attached to the left lateral and posterior wall of the uterus, exhibiting localized thickening. Within this area of thickening, there were observed inhomogeneous hypoechoic regions. (b) Superb Micro-vascular Imaging (SMI) revealed an abnormal echogenic region within the thickened placental tissue that exhibited a lack of microvascular blood flow signals, but demonstrated surrounding vascularity. Visually, this elliptical-shaped echogenic region was observed to be enveloped by microvascular blood flow. (c and d) Branched micro-vascular blood flow was observed in the normal placental tissue next to the lesion.
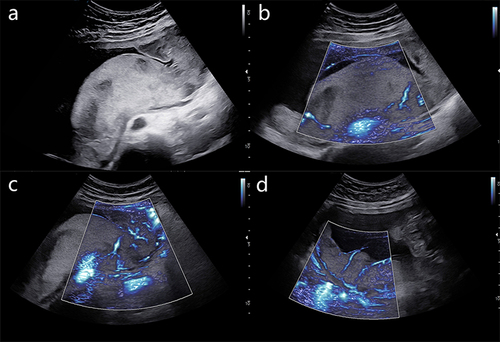
Figure 2 Follow-up ultrasound images. The lesion gradually transformed into (a) a local hypoechoic area of the placenta accompanied by (b) focal heterogeneous strong echo and decreased in size. It was (c) measured approximately 7.0×3.4×5.0 cm at 29 weeks and approximately (d) 3.9×3.9×4.2 cm at 36+6 weeks of gestation.
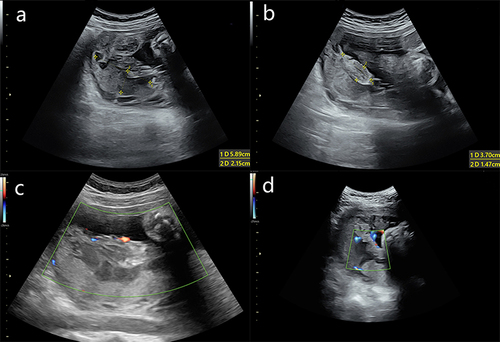
Figure 3 Fetal growth curve (NICHD Asian standard). From the 29th week of gestation, the ultrasound had suggested that the fetus was small for gestational age.
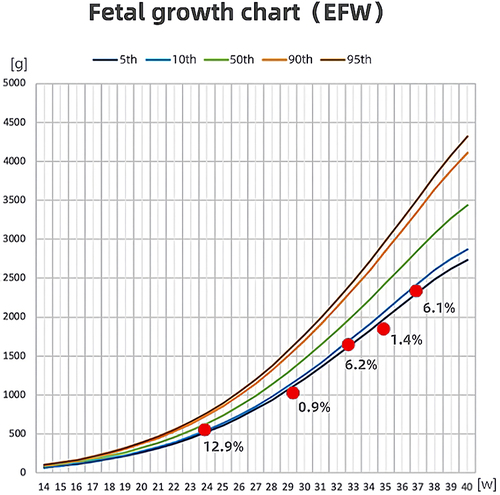
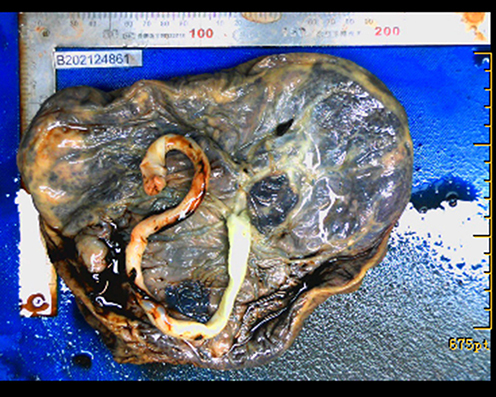
Figure 4 Image of the placenta. The placenta was approximately 20×18 cm in size and 450 g in weight, with large grayish-yellow infarcts.