Figures & data
Figure 1 Phase-contrast micrographs of triptolide-treated MCF-7 cells incubated for 24 hours.
Notes: (A) Control MCF-7 cells showed the normal MCF-7 cell formation. (B) At 5 ng/mL and (C) at 10 ng/mL, triptolide-treated cells reveal increased numbers of cell detachment from the culture plate. (D) At 15 ng/mL, triptolide-treated cells show more cells rounding with a substantial loss of cell–cell contact. (E) At 30 ng/mL, most of the triptolide-treated cells are rounded and significant cell detachment was observed. Cell–cell contact remained but the number of viable cells was reduced. Representative phase-contrast images of at least three independent studies are shown. The scale bar is 50 μm.
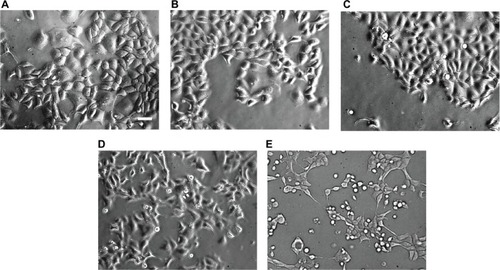
Figure 2 Effect of triptolide on chromatin condensation.
Notes: MCF-7 cells were treated in the absence (A) or presence (B) of 10 ng/mL triptolide for 24 hours and then exposed to Hoechst dye. (C) The percentage of apoptotic cells was determined by counting a minimum of 200 cells/treatment group in each experiment. (A) Normal nuclear morphology is observed in control cells. (B) In contrast, shrunken, fragmented, and condensed nuclei were observed in triptolide-treated cells. A minimum of 200 cells/treatment group were counted in each experiment. *Significant differences from control group (P < 0.0002). The images are representative of at least three independent experiments. The scale bar is 100 μm.
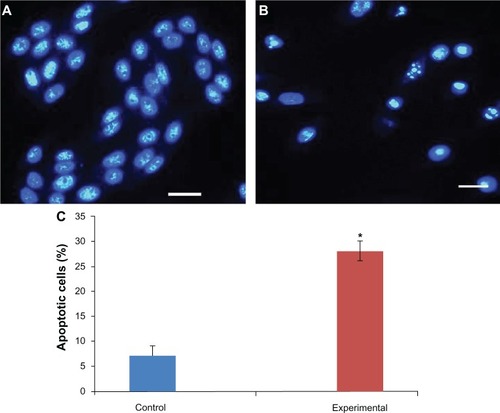
Figure 3 Cell death determination by MTT assay.
Notes: MCF-7 cells were plated in triplicate and treated with varying concentrations of triptolide (A) or for various incubation periods with 10 ng/mL triptolide (B) and the absorbance values were recorded. Values shown are means ± SEM of three independent experiments. Values were normalized to values obtained in vehicle-treated (control) cells and expressed as a percentage of controls. *P < 0.001; **P < 0.0001.
Abbreviations: MTT, 3-[4,5-dimethylthiazol-2-yl]-2,5-diphenyltetrazolium bromide; SEM, standard error of the mean.
Abbreviations: MTT, 3-[4,5-dimethylthiazol-2-yl]-2,5-diphenyltetrazolium bromide; SEM, standard error of the mean.
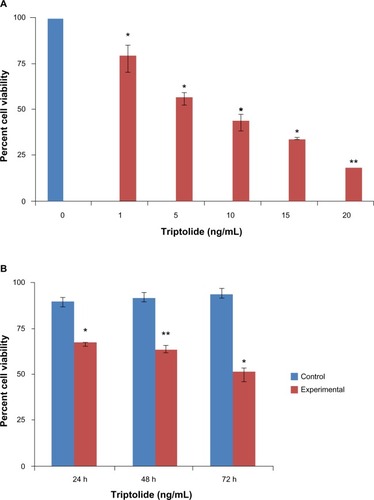
Figure 4 Effect of triptolide on pro-apoptotic proteins expression levels.
Notes: Whole-cell lysates of MCF-7 cells, untreated (control) or treated with various concentrations of triptolide for 24 hours, were subjected to 10% SDS-PAGE, followed by western blot analysis using anti- PARP, caspase-9, caspase-7, or β-actin antibody. A representative blot from at least triplicate experiments is shown. (A) Full-length PARP (116 kDa), caspase-9 (46 kDa), and caspase-7 (34 kDa) bands decreased dose-dependently with triptolide concentration. (B) Cleaved PARP (89 kDa), caspase-9 (35 kDa), and caspase-7 (20 kDa) were identified as increasing dose-dependently with triptolide concentration. The blots are representative of at least three independent experiments. β-actin reflects the loading control.
Abbreviations: PARP, poly(ADP-ribose) polymerase; SDS-PAGE, sodium dodecyl sulfate polyacrylamide gel electrophoresis.
Abbreviations: PARP, poly(ADP-ribose) polymerase; SDS-PAGE, sodium dodecyl sulfate polyacrylamide gel electrophoresis.
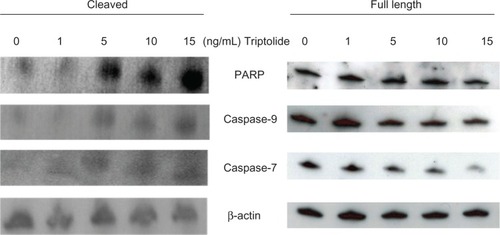
Figure 5 Effect of triptolide on lysosomal enzyme activity.
Notes: MCF-7 cells were treated in the presence or absence (control) of 10 ng/mL triptolide for the indicated incubation times shown on the x-axis. The values represent means ± standard error of the mean of at least three independent experiments. Total activity of acid phosphatase is expressed as μmoles p-nitrophenol released per 30 minutes, as indicated on the y-axis. Blue bars represent control cells and red bars represent experimental cells.
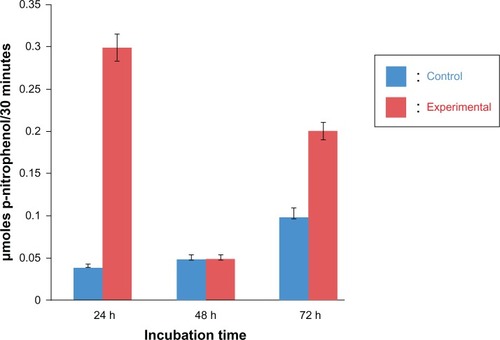
Figure 6 Effect of triptolide on localization of lysosomes.
Notes: Cells were treated in the absence (A–C) or presence (D–F) of 10 ng/mL triptolide for 24 hours and then stained with acridine orange (AO). Magnification: 400× in each field. Shown are representative images of three independent experiments. The scale bar represents 100 μm. The corresponding merged images are shown on the right (C and F).
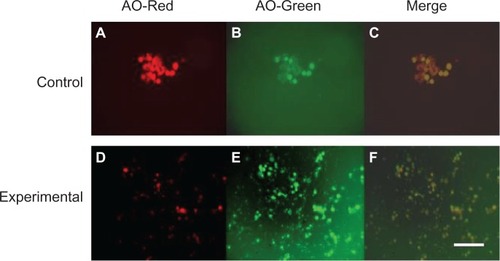
Figure 7 Morphological comparison of lysosomes.
Notes: MCF-7 cells were treated in the absence (A) or presence (B) of 10 ng/mL triptolide for 24 hours and then stained with LysoTracker® green (Molecular Probes; Life Technologies, Carlsbad, CA, USA). The corresponding merged images are shown in the upper panels. Phase-contrast micrographs are shown in the lower panels. Magnification: 400× in each field. The arrow indicates an aggregation of lysosomes in experimental cells. Shown are representative images of three independent experiments. The scale bar represents 50 μm.
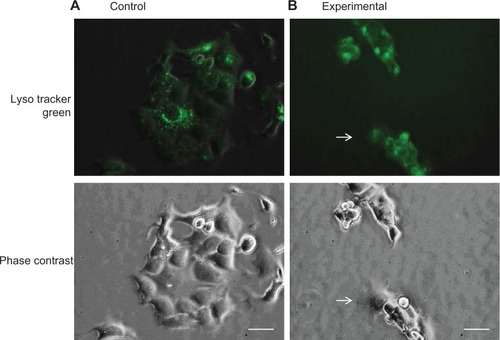
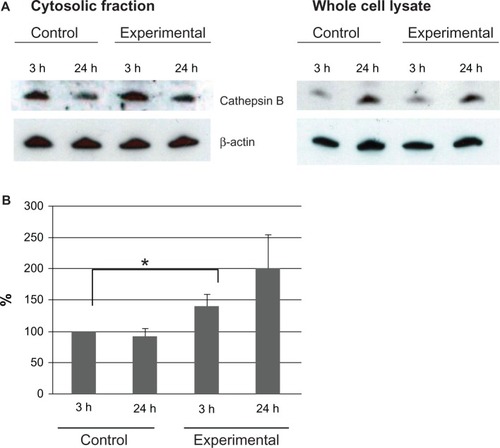
Figure 8 Lysosomal protein expression levels on cytosolic fraction of MCF-7 cells.
Notes: Cytosolic fractions of MCF-7 cells, untreated (control) or treated with 10 ng/mL triptolide (triptolide) for 3 or 24 hours, were investigated by western blot analysis. Western blot images are representative of three independent studies. β-actin reflects loading control. (A) Left: after 3-hour incubation (which is generally an early stage of apoptosis), triptolide-treated samples express elevated levels of the mature, active form of cathepsin B (31 kDa) in cytosolic fractions compared to controls. Right: unfractionated samples. (B) Using cathepsin B protein level images of cytosolic fraction, values were normalized to values obtained in controls and expressed as a percentage of controls. At the 3-hour time point, MCF-7 cytosol has more cathepsin B induced by triptolide. The values represent means ± standard deviation of at least three independent experiments. Student’s t-test was performed to evaluate differences. Values were considered statistically significant at *P < 0.05.