
Figures & data
Figure 1 The indirect effects of experimental provoked pain on dyspareunia severity through pelvic floor hypertonicity (PFHT) at different values of the PVD subgroups. The model shows significant unstandardized regression coefficients. Dashed lines highlight non-significant relationships (p < 0.05); NS (nonsignificant indirect effect when the 95% CIs contain zero); *p < 0.05; **p < 0.01; PVD: provoked-vestibulodynia; PFHT: pelvic floor hypertonicity.
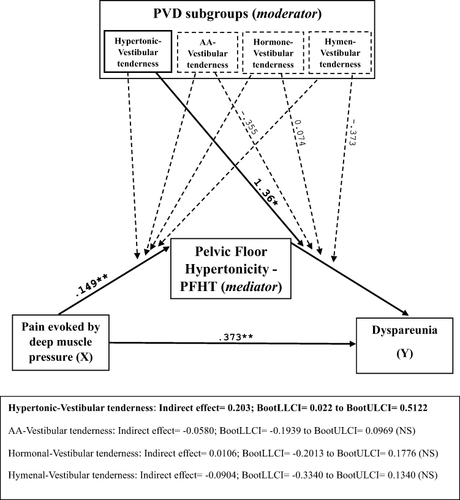
Table 1 Comparison of Vulvar Pain-Hypersensitivity Measures Between Patients and Controls
Table 2 Comparison of Correlations Between Dyspareunia Intensity Report and Experimentally Induced Pain Hypersensitivity Measures in Patients and Controls
Table 3 Correlations Between Experimentally Induced Pain Measures and Insertional Pain Intensity
Data Sharing Statement
The datasets analyzed for the current study are available from the corresponding author on reasonable request.