Figures & data
Table 1 Clinical Characteristics of the Triple Negative Breast Cancer Patients Included in the Study of Our Cohort
Figure 1 Intratumoral and stromal immune cells predict long-term survivors in formalin-fixed paraffin-embedded tissue sections (FFPE) of TNBC patient of our cohort. (A–H) Kaplan–Meier curves showed that patients with higher infiltration level of stromal B lymphocytes, stromal CD8+ T cells, stromal CD4+ T cells and lower Intratumoral tumor associated intratumoral 2 (TAM2) had significantly better survival than the others in univariate analysis (P<0.05).
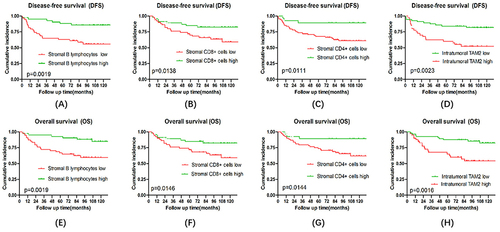
Table 2 Multivariate Analysis of Overall Survival (OS) and Disease-Free Survival (DFS) in Patients with Triple Negative Breast Cancer of Our Cohort
Figure 2 KM plot of different clusters in TNBC patients in public datasets and on our cohort. Tumor associated macrophages (TAMs), T cell (T lymphocytes), B cell (B lymphocytes). (A) KM plot of clusters 1–4 for OS in public datasets. It did not show significant difference of four clusters in KM plot (P>0.05). (B) KM plot of clusters 1 vs.2 for OS in public datasets. Cluster 2 (T lymphocytes-enriched subtypes) had significantly longer OS than Cluster 1 (Tumor associated macrophages-enriched subtypes) (P<0.05). (C) KM plot of clusters 1–3 for OS on our cohort. Significant difference of OS was observed between three clusters in KM plot (P<0.05). (D and E) KM plot of clusters 2 vs 3 for OS and DFS on our cohort. Cluster 2 (B lymphocytes-enriched subtypes) had significantly longer OS and DFS than Cluster 3 (Tumor associated macrophages-enriched subtypes) did (P<0.05). (F) KM plot of clusters 1 vs.3 for OS on our cohort. Cluster 1 (T lymphocytes-enriched subtypes) had significantly longer OS than Cluster 3 (Tumor associated macrophages-enriched subtypes) did (P<0.05).
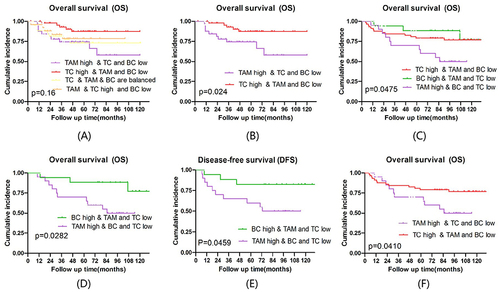
Figure 3 Hierarchical analyses of infiltration level of different immune cell types and different samples on our cohort. (A) Clustering of TNBC microenvironment phenotypes based on the estimated numbers of 5 immune cell (T cell, tumor associated Macrophage, myeloid derived suppressor cell (MDSC), natural killer (NK) and B cell) subsets calculated by MeV software. (B) Signature scores of T cell, B cell, and macrophage among clusters. ***p<0.001, ns means nonsense.
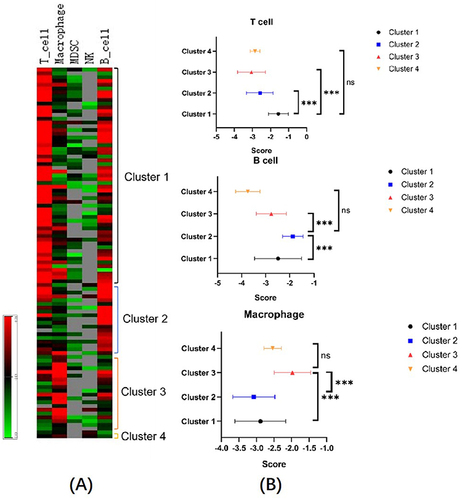
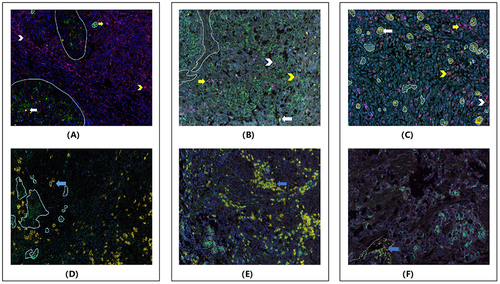
Figure 4 Representative images of different clusters after multiplexed immunofluorescence(mIF) staining in formalin fixed paraffin-embedded tissue sections(FFPE) of triple negative breast cancer of our cohort. (× 200). This information suggests that different subtypes of triple negative breast cancer can be characterized by variations in lymphocyte and macrophage infiltration. In the images, the light turquoise circle in (A, C, D and E) represents the tumor (Except for the tumor, it’s stroma), while the gray circle in (B and F) represents the stroma (Except for the stroma, it’s tumor). The various arrows indicate different cell types: White long arrow: Tumor-associated macrophages 1 (TAM1) - indicated in yellow; Yellow V-shape arrow: CD4+ T cells - indicated in pink; Yellow long arrow: Tumor-associated macrophages 2 (TAM2) - indicated in purple; White V-shape arrow: CD8+ T cells- indicated in red; Blue arrow: B lymphocytes - indicated in yellow. Based on the clusters identified: Cluster 1 (images A and D): T lymphocytes-enriched subtypes. These patients have higher infiltration of T lymphocytes but lower levels of tumor-associated macrophages and B lymphocytes. Cluster 2 (images B and E): B lymphocytes-enriched subtypes. These patients have higher infiltration of B lymphocytes but lower levels of T lymphocytes and tumor-associated macrophages. Cluster 3 (images C and F): Macrophage-enriched subtypes. These patients have higher infiltration of tumor-associated macrophages but lower levels of T lymphocytes and B lymphocytes.