
Figures & data
Table 1 The Sample Set Employed for the Study
Figure 1 STARD diagram to report flow of participants through the study.
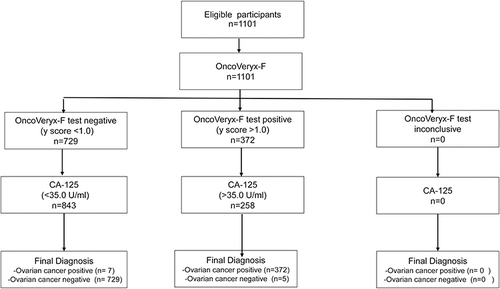
Figure 2 A comparison of the efficacies of OncoVeryx-F and CA 125-based testing for OvC detection. (A) Shows the confusion matrix generated from the y-scores estimated by OncoVeryx-F for the individual OvC and NoC samples. The sensitivity obtained was 98.6% (96.41, 100) at 95% CI, at a specificity of 99.03% (97.08, 100) at 95% CI, and the accuracy was 98.85% (97.32, 100) at 95% CI. (B) Shows the corresponding matrix obtained when OvC versus NoC discrimination was derived on the basis of the CA 125 cut-off level of 35 U/mL. The sensitivity and specificity obtained in each case is also given here.
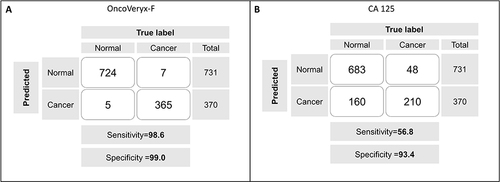
Figure 3 Ethnicity-dependence of the performance of CA 125 and OncoVeryx-F for OvC detection. Shows the distribution of CA 125 concentrations in samples from the OvC and NoC groups in both Caucasian and South Asian/Indian women.
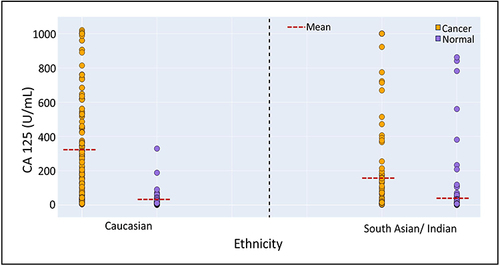
Table 2 Ethnicity-Dependant OvC-Detection Accuracy of CA 125 and OncoVeryx-F Test
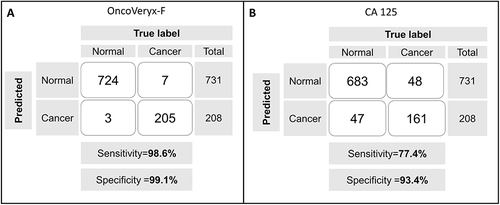
Figure 4 Comparative efficacy of Stage I OvC detection by OncoVeryx-F and CA 125. Shown here are the confusion matrices obtained for detection of Stage I OvC samples using either OncoVeryx-F (A) or CA 125 (B) as the test system.
Data Sharing Statement
Individual deidentified participant data will be available for six months from date of publication of the corresponding author.