Figures & data
Figure 1 Trial design and efficacy evaluation. (A). Trial design and timeline of the study. (B). Enhanced pelvic CT scans of patient 1 at pre-TILs infusion, 6 weeks, and 12 weeks post treatment showed a targeted lesion of 4.9cm, 3.3cm, and 3.0cm, respectively, suggesting a rapid tumor shrinkage. CT scans of patient 2 at pre-TILs infusion and 6 weeks post treatment showed a targeted lesion of 5.9cm and 5.8cm, respectively, showing a stable disease. (C). Tumor size measurements of the two patients before and after treatment. (D and E). Levels of serum biomarkers CA125 and CA153 of the two patients decreased after TILs infusion suggesting that their disease were in control.
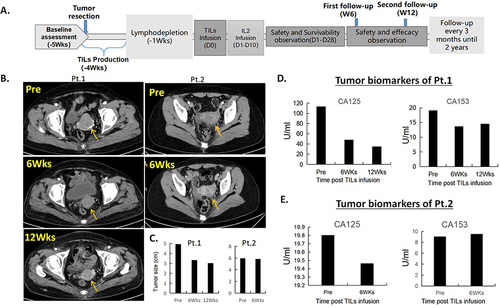
Figure 2 Characterization of TILs and lymphocytes from the peripheral blood during treatment and changes in T cell subtypes in the peripheral blood. (A). Flow cytometry analysis of the TILs products of patient 1 and 2 showing that among the infused TILs product, 97% and 99.6% of the TILs are CD3+ T cells, 56.6% and 62.8% of the TILs are CD3+CD8+T cells, 28.5% and 11.7% of the TILs are CD3+CD4+T cells, 88.9% and 90.2% of the TILs are CD3+TCR-αβ+T cells, and 0.06% and 0.01% of the TILs are EpCAM+ cells. (B). Quantifications of peripheral blood lymphocytes during treatment showed that the two patients maintained a high percentage of lymphocytes until 12 weeks and 6 weeks post treatment. PBMCs, Peripheral Blood Monocytes.
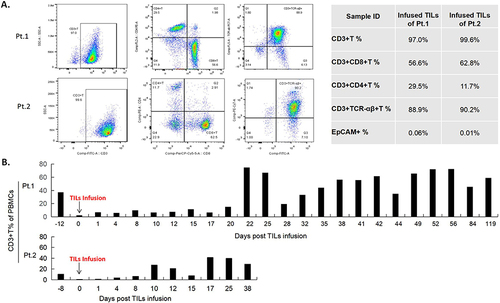
Figure 3 Peripheral T cell sub-typing analysis of the patients. (A). For patient 1, quantifications of percentages of CD4+ and CD8+ T cells over treatment showed a high percentage of CD8+ T cells on day 15 post TILs infusion. Percentages of terminally exhausted CD8+CD39+ and NTB-A-CD69+ T cells remained low on day 4 post TILs infusion. Percentages of CD103+ memory T cells and CCR7+ naive T cells are low right after infusion. Percentage of regulatory T cells (CD3+CD4+CD25+) decreased on day 15 after infusion compared with pre-treatment. (B). Measurements of peripheral T cell sub-types of patient 2 showed similar trends as patient 1 in regarding of percentages of CD4+ and CD8+ T cells, terminally exhausted CD8+CD39+ and NTB-A-CD69+ T cells, CD103+ memory T cells and CCR7+ naive T cells, and regulatory T cells (CD3+CD4+CD25+).
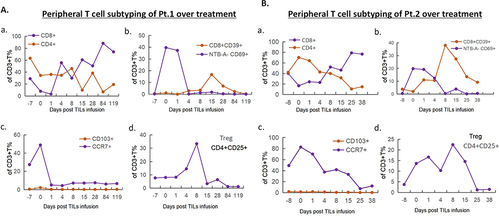
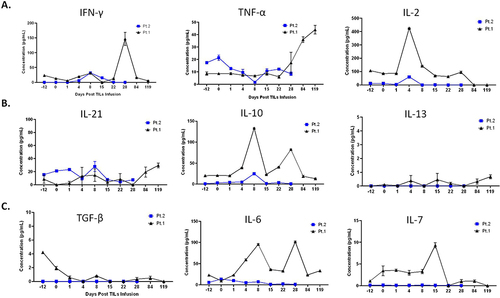
Figure 4 Characterization of cytokines in peripheral blood of the patients over treatment. Changes in secreted cytokines from Th1 cells (A) and Th2 cells (B) during treatment. (C). Tumor growth factor-β1 (TGF-β1) decreased right after TILs infusion and IL6-7 changes over treatment. **Please note that, in order to put the data of patient 1 and 2 in one figure, time points of Day-12, Day 22, and Day 28 for patient 2 were in fact Day −8, Day 25 and Day 38 in the figure.