
Figures & data
Figure 1 Time course of the study design.
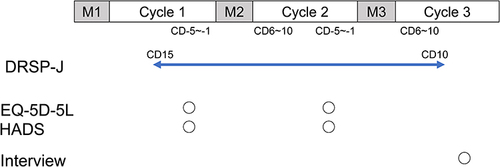
Table 1 Factor Coefficients of the DRSP-J After Promax Rotation (N=113)
Table 2 Characteristics of Study Participants (N=113)
Table 3 Internal Consistency (Cronbach’s α) for the Summary Scores of the DRSP-J (N=113)
Table 4 Test-Retest Intraclass Correlation Coefficients of DRSP-J Total Scores and Negative Mood Score (N=113)*
Figure 2 Scree plot for the DRSP-J.
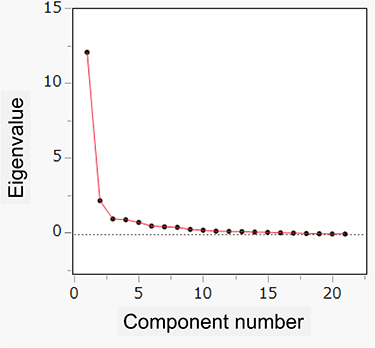
Table 5 Correlation of Luteal Phase DRSP-J Score with HADS and EQ-5D-5L (N=113)
Table 6 Consistency Between Conventional Clinical Judgement and Severity Classification by DRSP-J Score (N=113)
Table 7 Comparison of EQ-5D-5L Scores in the Luteal Phase by Severity of Premenstrual Symptoms
Data Sharing Statement
The data obtained in this study are available from the corresponding author upon request.