
Figures & data
Table 1 Patient Baseline Characteristics Before and After Propensity Score Matching
Figure 1 The patient selection flowchart.
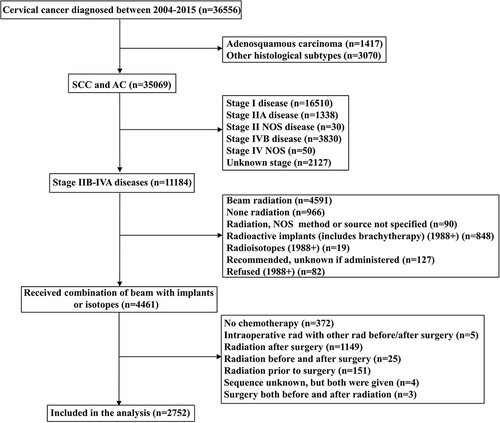
Figure 2 Comparison of cause-specific survival (A) and overall survival (B) between cervical squamous cell carcinoma (SCC) and adenocarcinoma (AC) before propensity score matching.
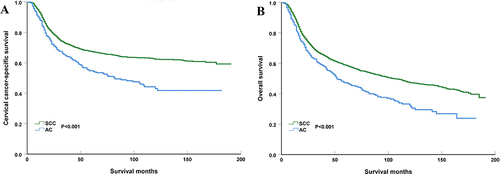
Figure 3 Comparison of cause-specific survival (A) and overall survival (B) between cervical squamous cell carcinoma (SCC) and adenocarcinoma (AC) after propensity score matching.
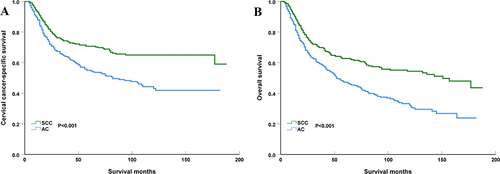
Figure 4 Annual hazard rates for cervical cancer-related death between cervical squamous cell carcinoma (SCC) and adenocarcinoma (AC) (the horizontal axis refers to the year of follow-up; the vertical axis refers to annual hazard rates).
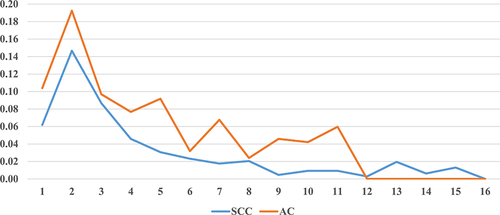
Table 2 Multivariate Prognostic Analysis for Independent Prognostic Factors Associated with Cervical Cancer-Specific Survival and Overall Survival Before Propensity Score Matching
Table 3 Sensitivity Analysis of the Impact of Histology (Adenocarcinoma vs Squamous Cell Carcinoma) on Cervical Cancer-Specific Survival and Overall Survival After Stratification by Age, Race, Tumor Grade, and FIGO Stage
Table 4 Multivariate Prognostic Analysis for Independent Prognostic Factors Associated with Cervical Cancer-Specific Survival and Overall Survival After Propensity Score Matching