
Figures & data
Table 1 Classifications and Sites of Onset of PEComas
Figure 1 The locations of the tumor on transvaginal ultrasound apparatus (A, white arrows) and Color Doppler flow imaging (CDFI) results (B–D), red and light blue arrows).
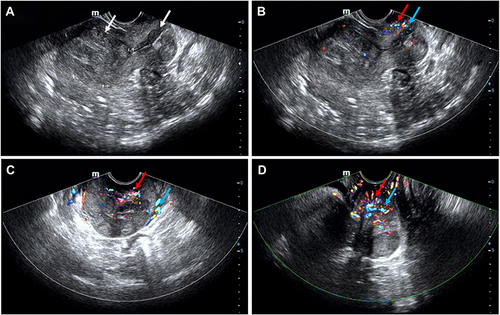
Figure 2 Hematoxylin and eosin (H&E) staining ((A): 100 ×, (B) 200 ×). Red arrows indicate the nested pattern of tumor cells around capillaries, blue ones indicate the apoptosis of tumor cells, and the yellow indicate the spindled cells.
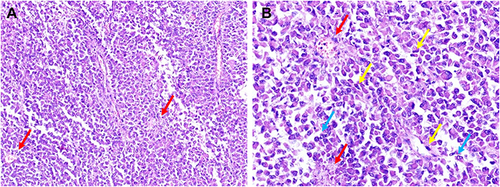
Figure 3 The tumor cells showed immunohistochemical positivity for Melan-A (A) and Desmin (B).
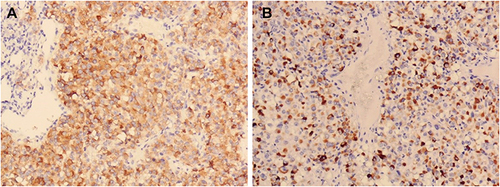
Figure 4 The location and TWI signal ((A): T2WI, (B) T1WI) of the tumor on MRI. The red arrows indicate the locations of the tumor.
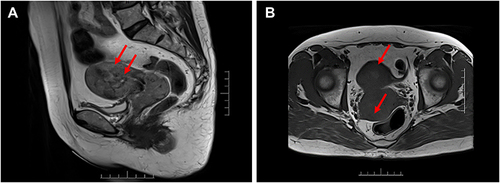
Figure 5 Multiple thin-walled cysts in both lungs on different sections of CT (A and B), which were 10–30 mm in size, rounded, and devoid of internal structure. The red arrows indicate the locations of cysts.
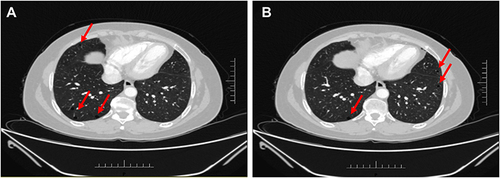
Figure 6 Macroscopic view of the uterus, bilateral adnexa and bilateral pelvic lymph nodes. The yellow arrow indicates the involved lymph nodes (A). The red arrow indicates the tumor’s original location (A and B).
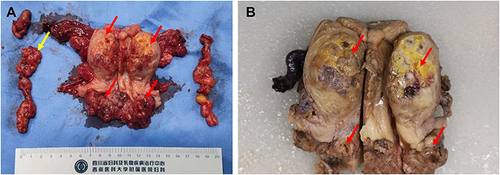
Table 2 Classification of Uterus PEComa