
Figures & data
Table 1 The Basic Information of the Included Study Population
Figure 1 A diagram flow describing the patients’ selection. NHANES, National Health and Nutrition Examination Survey.
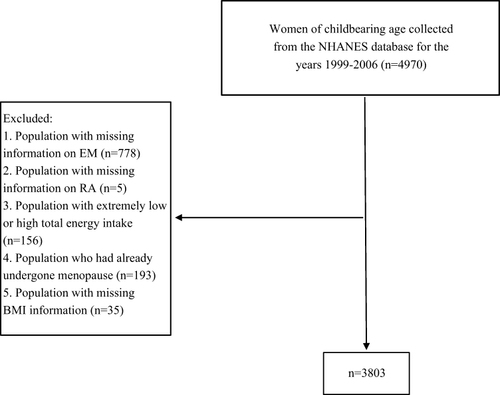
Table 2 Association of CDAI, and EM with the Risk of RA
Table 3 The Interaction Between CDAI and EM on the Risk of RA
Table 4 Evaluations of the Additive Interaction Results
Table 5 Coexistence of CDAI and EM on the Risk of RA