Figures & data
Figure 1 Comparison of the percentage and absolute count of Treg and Th17 cells and the Th17/Treg ratio between the unexplained infertility (UI) group and the control group. ns, P > 0.05, * P < 0.05, **P < 0.01, ***P < 0.001. (A) Comparison of the percentage of Treg cells (P < 0.01). (B) Comparison of the absolute count of Treg cells (P > 0.05). (C) Comparison of the percentage of Th17 cells (P < 0.05). (D) Comparison of the absolute count of Th17 cells (P < 0.05). (E) Comparison of the ratio of Th17/Treg cells (P < 0.001).
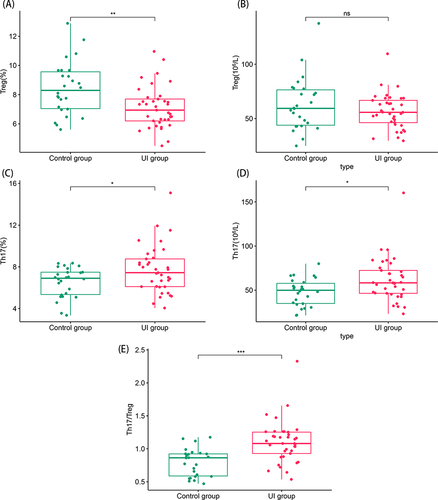
Figure 2 ROC curve used to diagnose unexplained infertility using the percentage of Treg and Th17 cells, the absolute count of Th17 cells, and the Th17/Treg ratio.
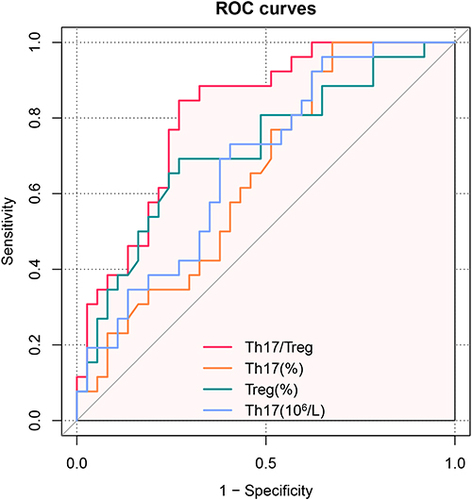
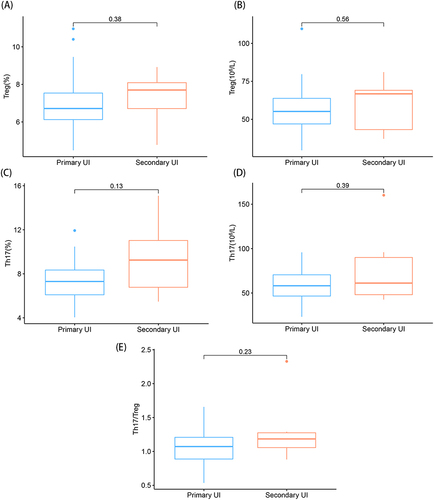
Figure 3 Comparison among the percentages and absolute counts of Treg and Th17 cells and the Th17/Treg ratios for primary and secondary unexplained infertility. (A) Comparison of the percentages of Treg cells; (B) Comparison of the absolute counts of Treg cells; (C) Comparison of the percentages of Th17 cells; (D) Comparison of the absolute counts of Th17 cells; (E) Comparison of the ratios of Th17/Treg cells.