Figures & data
Table 1 Comparisons Between Included (n=270) and Excluded (n=100a) Participants at SWAN Sleep Study Baseline
Table 2 Sleep Health Dimension Comparisons, Binary and Continuous, for Included (n=270) and Excluded (n=100 a) Participants at SWAN Sleep Study Baseline
Figure 1 Participant flow chart for Sleep Study I.
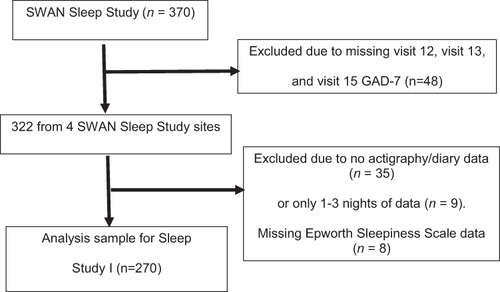
Table 3 Parameter Estimates (Standard Error) for Sleep Health Dimension Associations with Generalized Anxiety Disorder – 7-Item Scale (GAD-7) Score, with and without State-Trait Anxiety Inventory – State Version (STAI) Score as Baseline Covariate
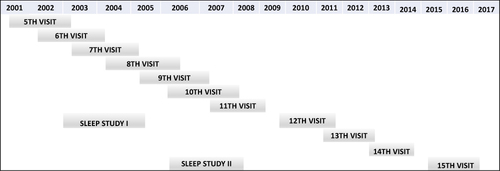
Figure 2 Time line for SWAN visits and Sleep Study I and II.
Notes: SWAN Sleep Study I was conducted between 2003 and 2005, corresponding to core SWAN visits 5–8. Sleep Study II was conducted between 2006 and 2008, corresponding to core SWAN visits 8–10. The three Generalized Anxiety Disorder (GAD-7) scale assessments were administered at core SWAN visits 12 (2009–2011), 13 (2011–2013), and 15 (2015–2017).