
Figures & data
Figure 1 FET protocols.
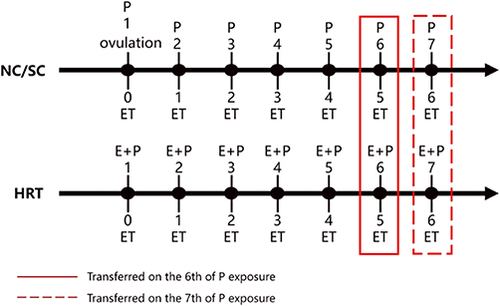
Table 1 Patients Characteristics Between Group A and Group B
Table 2 Frozen-Embryo Transfer Cycles Parameters and Pregnancy Outcomes Between Group A and Group B
Table 3 Pregnancy Outcomes of the Subgroup Analysis Comparing Group A with Group B in NC, SC and HRC Respectively
Table 4 Multivariable Regression Analysis of Preterm Birth Rate
Table 5 Univariable Analysis of Patients (with No Preterm Birth or Preterm Birth)’ Basic Characteristics in Natural Cycles
Table 6 Characteristics of Patients with Excellent and Average Blastocyst Morphological Grades Between Group C and Group D
Table 7 Frozen-Embryo Transfer Cycles Parameters and Pregnancy Outcomes Between Group C and Group D in Patients with Excellent and Average Blastocyst Morphological Grades
Data Sharing Statement
The data used to support the findings of this study are included in the article. Also, if readers need detailed information, he/she can Email the corresponding author.