
Figures & data
Figure 1 Case collection flow chart.
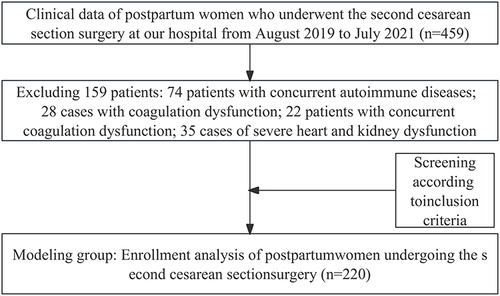
Table 1 Comparison of Clinical Data Between Two Groups in the Modeling Group()/[n(%)]
Table 2 Analysis of Risk Factors for Postpartum Hemorrhage in Pregnant Women Undergoing the Second Cesarean Section
Figure 2 Column chart model for predicting the risk of postpartum hemorrhage in pregnant women undergoing a second cesarean section.
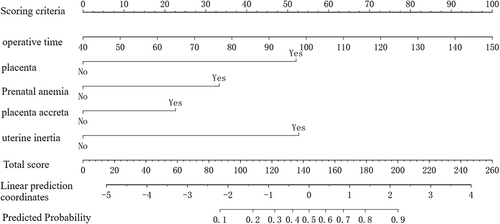
Figure 3 Internal validation of the haemorrhage nomogram model after the second caesarean section (A) ROC curve; (B) Calibration curve.
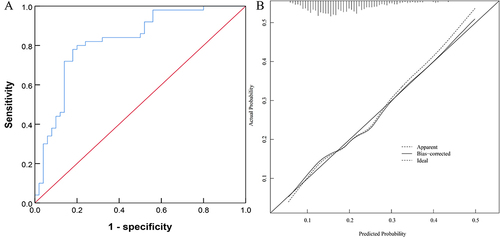
Table 3 Comparison of Clinical Data Between Two Groups in the Validation Group()/[n(%)]
Figure 4 External validation of the hemorrhage nomogram model after the second caesarean section. (A) ROC curve; (B) Calibration curve.
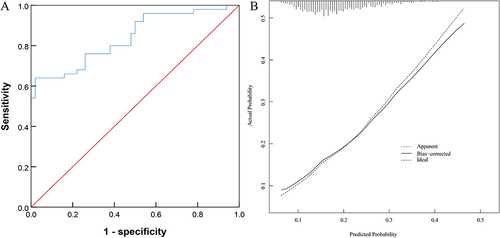
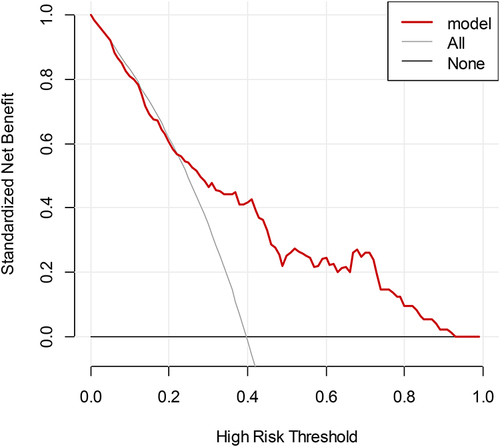
Figure 5 DCA curve.
Data Sharing Statement
Data and material are available on request from the corresponding author.