Figures & data
Table 1 Comparison of Descriptive Statistics and Anthropometric Measurements of the Groups
Table 2 Prevalence of Metabolic Abnormalities and MetS Among Groups
Table 3 Univariate and Multivariate Logistic Regression Analysis of the Variables for MetS
Figure 1 Flow Chart of the Study.
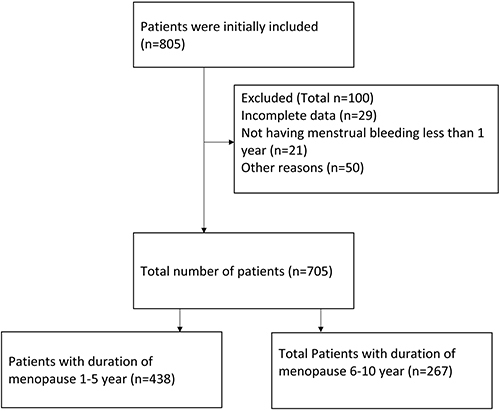
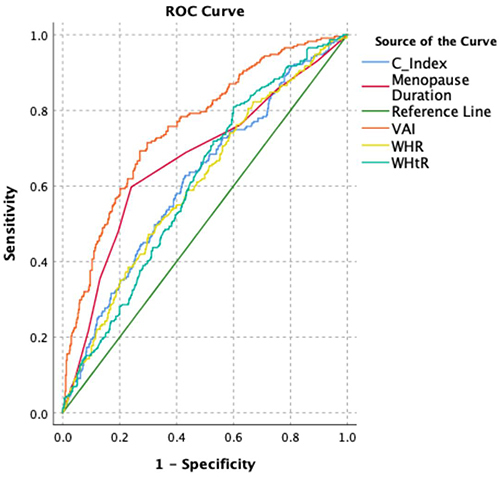
Figure 2 ROC analysis of C-index, Menopause Duration, VAI, WHR and WHtR for predictability of MetS (AUC of C-index:0.612, cut off point: 1.632 sensitivity:60.6%, specificity:58.1%; AUC of VAI:0.755, cut off point:2.19, sensitivity:71.4%, specificity:70.3%, AUC of WHtR:0.607, cut off point:0.61, sensitivity:57.1%, specificity:56.8%, AUC of WHR:0.755, cut off point:0.89, sensitivity:58%, specificity:57.1%, AUC of Menopause Duration: 0.667, cut off point:5, sensitivity:68.8%, specificity:62.4%).