Figures & data
Table 1 Rates of vaginal deliveries, cesarean deliveries, and elective cesarean deliveries in each Peruvian geographical region (coast, highlands, jungle) in 43 health care centers according to scarred uterus, prior pregnancies, preeclampsia, and level of the hospital in which deliveries were attended
Figure 1 Trends for cesarean section rates in Peru according to geographical region, 2000–2010.
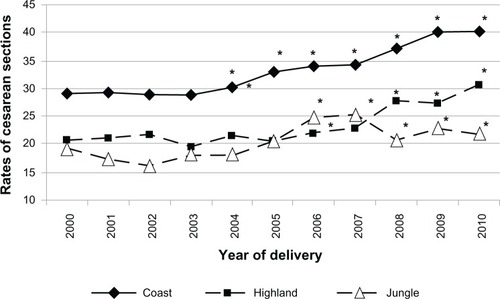
Figure 2 Main indications for cesarean section rates in 43 Peruvian health facilities, 2000–2010.
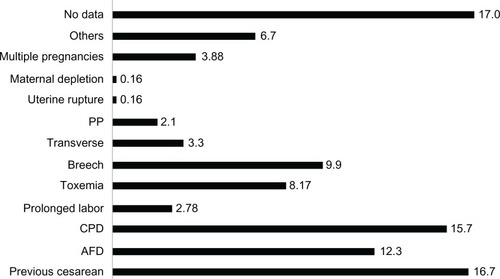
Table 2 Rates of adverse pregnancy outcomes according to the mode of delivery (vaginal or cesarean section) in 43 health facilities in Peru, 2000–2010
Table 3 Rates of adverse pregnancy outcomes in 43 health facilities in Peru by type of delivery within each cesarean section rate (CSR) level, 2000–2010
Figure 3 Trends for elective and emergency cesarean deliveries in 43 Peruvian health care centers, 2000–2010.
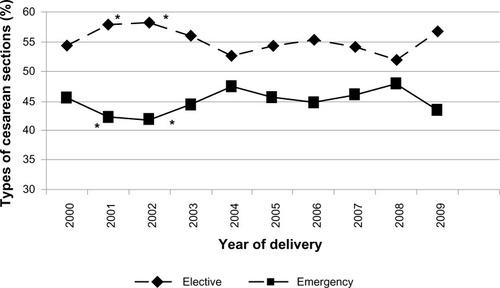
Table 4 ORs for maternal mortality associated with cesarean deliveries in 43 Peruvian health care centers, 2000–2010