Figures & data
Table 1 Physiological characteristics of the participants
Figure 1 Schematic of the 6 × 10-second intermittent sprint test.
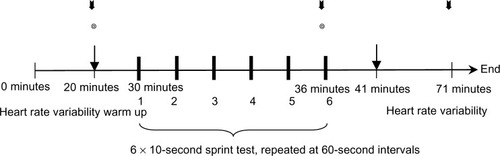
Figure 2 The participants’ anaerobic performance and fatigue index during the 6 × 10-second IST.
Abbreviation: IST, an intermittent sprint test.
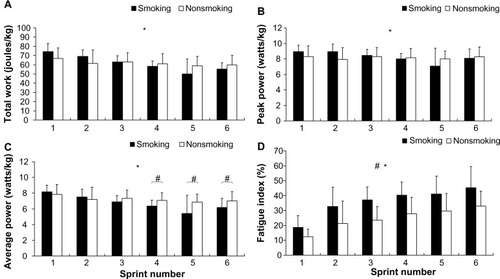
Figure 3 Rating of perceived exertion for smoking and nonsmoking groups during the intermittent sprint test.
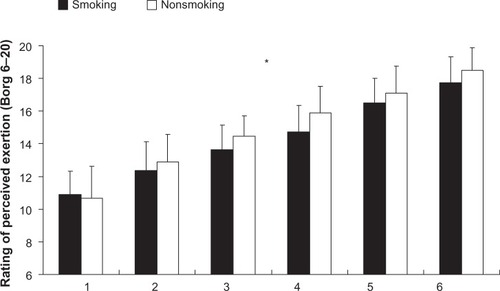
Table 2 Blood pressure at various time points for the participants in the smoking and nonsmoking groups
Figure 4 Time-domain analysis of heart rate variability at rest and after the 6 × 10-second intermittent sprint test for the participants in the smoking and nonsmoking groups.
Abbreviations: Pre-Ex, preexercise; Post-Ex, postexercise; SDNN, standard deviation of the normal to normal interval; RMSDD, root mean square successive difference; pNN50, percentage of adjacent normal R–R intervals >50 ms.
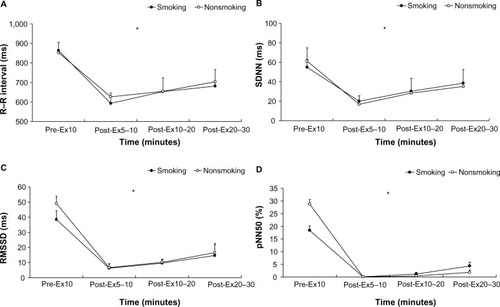
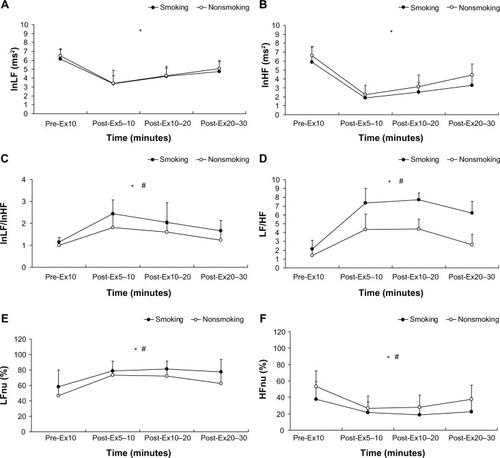
Figure 5 Frequency-domain analysis of heart rate variability at rest and after the 6 × 10-second intermittent sprint test for the participants in the smoking and nonsmoking groups.
Abbreviations: lnLF, natural logarithm of low frequency; Pre-Ex, preexercise; Post-Ex, postexercise; lnHF, natural logarithm of high frequency; lnLF/lnHF, natural logarithm of low/high frequency; LF/HF, low frequency/high frequency ratio; LFnu, normalized LF; HFnu, normalized HF.