
Figures & data
Figure 1 Para/intracervical block injection sites.
Notes: The para/intracervical block group received a total of 37 cc of anesthetic, administered at six injections sites: 2 cc superficially at 12:00; 10 cc at 3:00; and 10 cc at 9:00, in the cervical vaginal junction, superficially through mucosa, approximately 0.5 cm deep; 5 cc at 4:00; and 5 cc at 8:00, approximately 1 to 2 cm deep, halfway between the canal and the lateral edge of the cervix; and 5 cc submucosally at 6:00, between the uterosacral ligaments, approximately 0.5 cm below the cervical vaginal junction. Topical 1% lidocaine gel was applied to the cervix, with a set time of 2 to 3 minutes prior to the injection of anesthetic, for the para/intracervical block group only. Figure provided courtesy of Mark Glasser, MD.
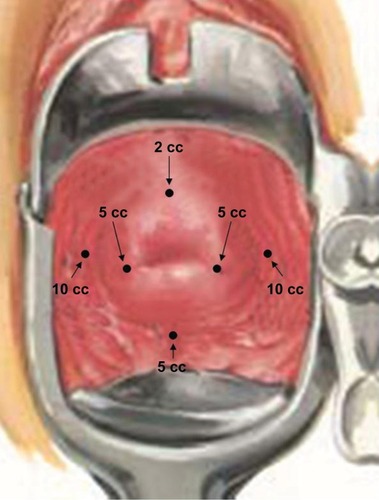
Figure 2 Intracervical block injection sites.
Notes: The intracervical block group received a total of 22 cc of 1% lidocaine and 0.25% bupivacaine, administered at three injections sites: 2 cc superficially at 12:00; 10 cc at 4:00; and 10 cc at 8:00, approximately 1 to 2 cm deep. Figure provided courtesy of Mark Glasser, MD.
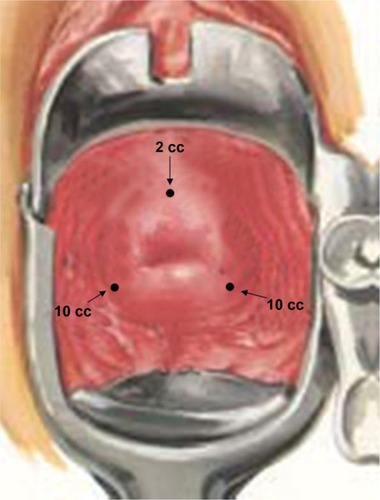
Figure 3 Hysteroscopic image of the MyoSure® tissue removal device in the uterine cavity.
Note: Resection of myomatous tissue with the MyoSure device, midway through the procedure.
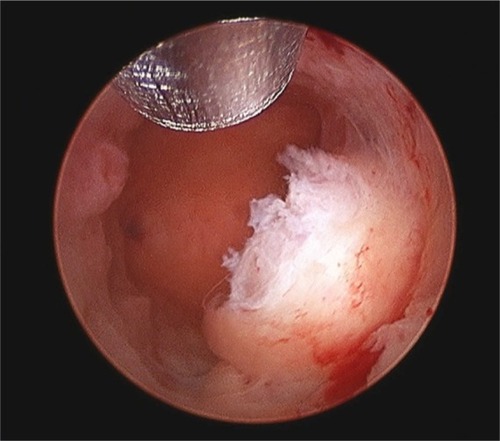
Table 1 Subject demographic characteristics and gynecological history
Table 2 Summary of lesions, by hysteroscopic evaluation
Table 3 Procedure-related and postprocedure recovery pain scores