
Figures & data
Figure 1 Age distribution of live births in 5 years preceding the Nigeria 2008 Demographic and Health Survey.
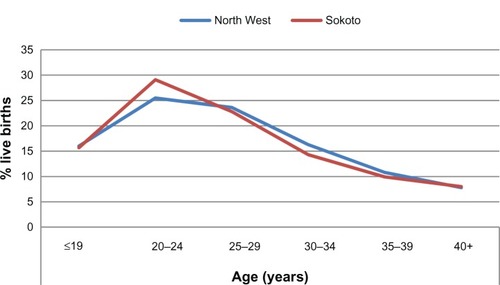
Table 1 Description of outcome and predictor variables
Table 2 Socioeconomic differentials in live births in 5 years before the Nigeria 2008 Demographic and Health Survey, Sokoto State, Nigeria
Table 3 Differentials in live births by mother’s autonomy characteristics, Sokoto State, Nigeria, Nigeria 2008 Demographic and Health Survey
Figure 2 Distribution of deliveries with no one present (NOP) in 5 years preceding the Nigeria 2008 Demographic and Health Survey by mother’s age, Sokoto State, Nigeria.
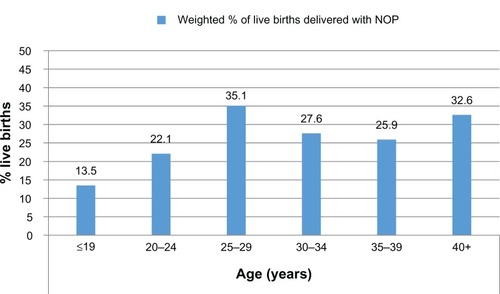
Figure 3 Socioeconomic differentials in births delivered with no one present in 5 years preceding the Nigeria 2008 Demographic and Health Survey, Sokoto State, Nigeria.
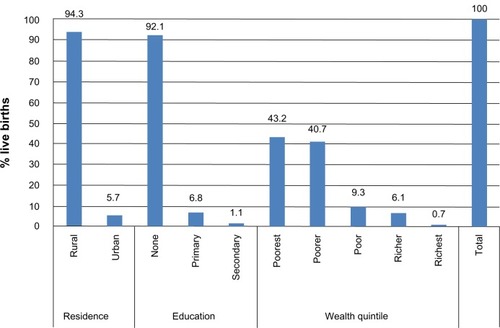
Figure 4 Distribution of live births by delivery assistance received in 5 years preceding the Nigeria 2008 Demographic and Health Survey, Sokoto State, Nigeria.
Abbreviation: TBA, traditional birth attendant.
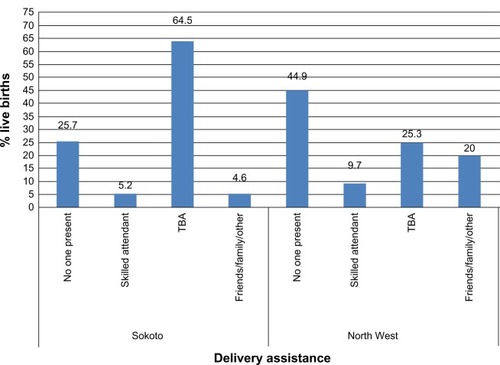
Figure 5 Distribution of live births in 5 years preceding the Nigeria 2008 Demographic and Health Survey by mother’s age and type of delivery assistance, Sokoto, Nigeria.
Abbreviation: TBA, traditional birth attendant.
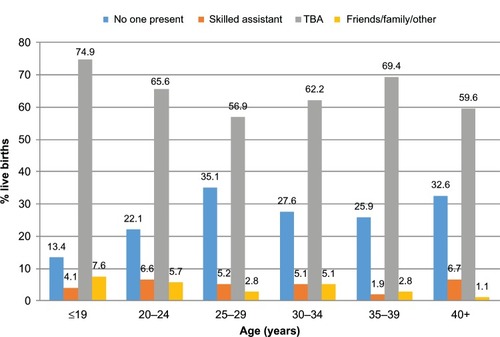
Table 4 Delivery assistance in 5 years preceding the Nigeria 2008 Demographic and Health Survey by socioeconomic characteristics, Sokoto State, Nigeria
Table 5 Distribution of live births with specific delivery assistances by mother’s autonomy characteristics, Sokoto State, Nigeria, Nigeria 2008 Demographic and Health Survey
Table 6 Influential factors in the use of delivery attendants in Sokoto State, Nigeria, Nigeria 2008 Demographic and Health Survey