Figures & data
Figure 1 Structural formula of the progestin, dienogest, compared with naturally occurring progesterone.
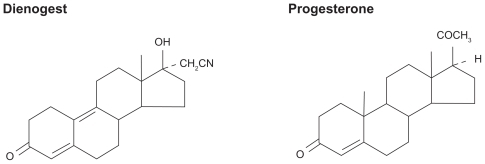
Figure 2 Change in visual analog scale (VAS) score during the placebo-controlled (A) and the extension (B) studies.Citation54,Citation62
Note: Reprinted in part from Strowitzki T et al,Citation54 with permission from Elsevier.
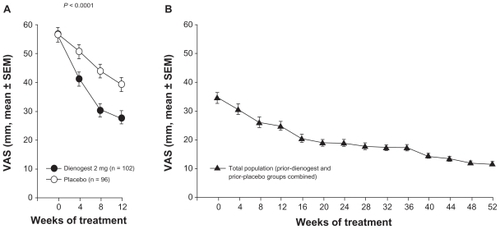
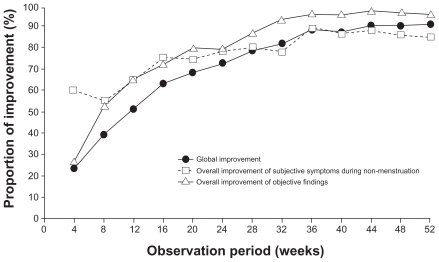
Figure 3 Increase over time in the proportion of cases assessed as “marked or moderate” for global improvement, overall improvement of subjective symptoms during non-menstruation, and overall improvement of objective findings.Citation58
Note: Reprinted from Momoeda et alCitation63 with permission from John Wiley & Sons.