
Figures & data
Figure 1 Percentage of women experiencing an unintended pregnancy during the first year of typical use and the first year of perfect use of contraception in the United States.
Notes:
†Depo-Provera (Pfizer, Inc., New York, NY, USA); ‡ParaGard® T-380A (Teva Women’s Health, Inc., Sellersville, PA, USA); ¶Mirena; ††Implanon (Merck Sharp & Dohme [Hertfordshire, UK]). Reprinted from Contraception, 83(5), Trussell J, Contraceptive failure in the United States, 397–404, Copyright © 2011, with permission from Elsevier.Citation10
Abbreviations: COP, combined oral pill; IUD, intrauterine device; IUS, intrauterine system; POP, progestogen-only pill.
Abbreviations: COP, combined oral pill; IUD, intrauterine device; IUS, intrauterine system; POP, progestogen-only pill.
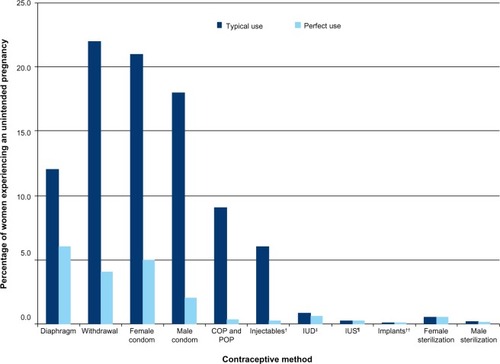
Figure 2 Number of LARC cycles sold from 1998–2011.
Notes: (A) By method, primary and secondary care combined; (B) by age group; (C) primary care only; (D) secondary care only.
Abbreviations: IUD, intrauterine device; LARC, long-acting reversible contraceptive.
Abbreviations: IUD, intrauterine device; LARC, long-acting reversible contraceptive.
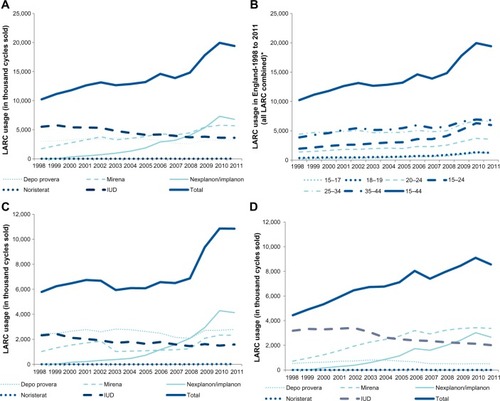
Figure 3 LARC usage and outcomes rates in women aged <18 years.
Notes:
P-values represent †the statistical significance of rate change over time and ‡the association between the rate change and LARC usage.
Abbreviations: HIV, human immunodeficiency virus; LARC, long-acting reversible contraceptive; NICE, National Institute for Health and Care Excellence; QOF, Quality and Outcomes Framework.
Abbreviations: HIV, human immunodeficiency virus; LARC, long-acting reversible contraceptive; NICE, National Institute for Health and Care Excellence; QOF, Quality and Outcomes Framework.
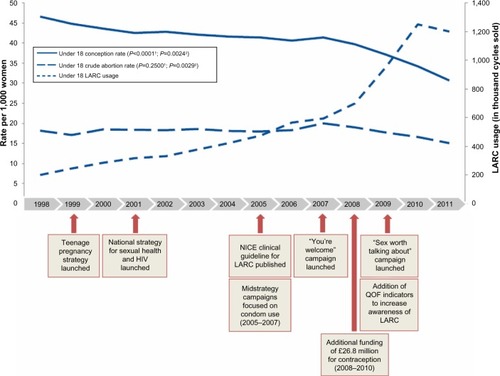
Figure 4 LARC usage and crude abortion rates and age-standardized abortion rates.
Notes: Crude abortion rates per 1,000 women aged (A) 18–19 years; (B) 20–24 years; (C) 25–34 years; and age-standardized abortion rates per 1,000 women aged (D) 15–44 years. P-values represent †the statistical significance of rate change over time and ‡the association between the rate change and LARC usage.
Abbreviation: LARC, long-acting reversible contraceptive.
Abbreviation: LARC, long-acting reversible contraceptive.
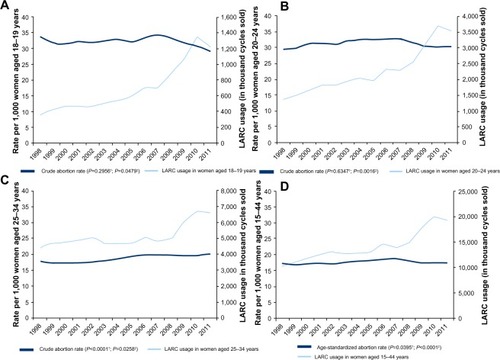
Figure 5 Percentage of repeat abortions.
Note:
†P-values represent the statistical significance of rate change over time.
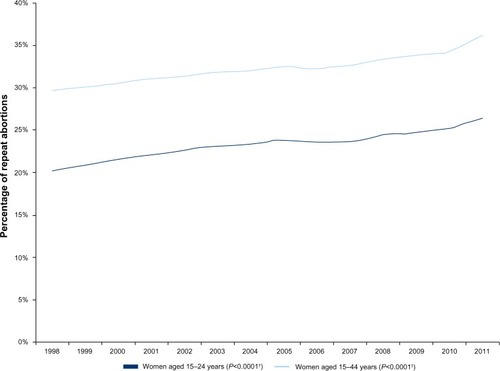
Table S1 Data collection and aligning methods for conception, abortion, and LARC usage methods
Table S2 Estimated average duration of LARC use