
Figures & data
Table 1 Age distribution of pregnant and nonpregnant women with IgM and IgG antibodies
Table 2 Seroprevalence of rubella IgM and IgG antibodies among pregnant women according to their trimester of pregnancy
Table 3 Seroprevalence of rubella IgM and IgG antibodies among pregnant women according to their reproductive characteristics
Table 4 Seroprevalence of rubella IgM and IgG antibodies among pregnant women according to their sociodemographic data
Table 5 Seroprevalence of rubella IgM and IgG antibodies among pregnant women according to risk factors
Figure 1 Frequency of the level of awareness and knowledge of rubella.
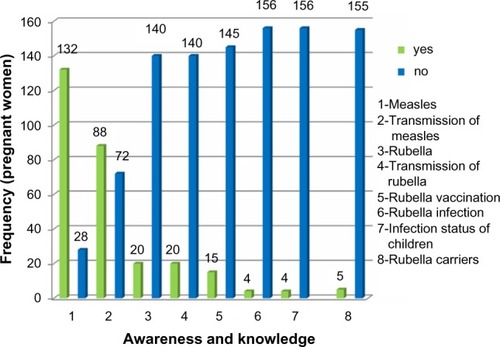
Table 6 Seroprevalence of rubella IgM and IgG antibodies among pregnant and nonpregnant women according to clinical symptoms associated with rubella