Figures & data
Table 1 The hematological data of the four groups – group 1: nonsickling hemoglobinopathies (24); group 2: IDA (89); group 3: anemia of other etiology (62); group 4: normal (654)
Figure 1 Receiver operating characteristic curves of the three parameters for nonsickling hemoglobinopathy screening among nonanemic women.
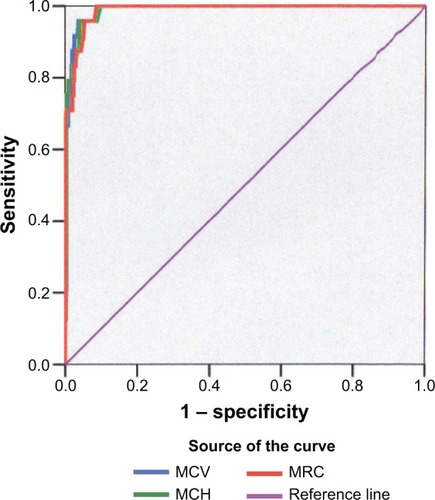
Table 2 Specificity, sensitivity, PPV, NPV, and Youden’s index of different cut-off levels for MCV in (a) nonanemic pregnant women and (b) women with IDA
Table 3 Specificity, sensitivity, PPV, NPV, and Youden’s index of different cut-off levels for MCH in (a) nonanemic pregnant women and (b) women with IDA
Table 4 Specificity, sensitivity, PPV, NPV, and Youden’s index of different cut-off levels for MRC in (a) nonanemic pregnant women and (b) women with IDA
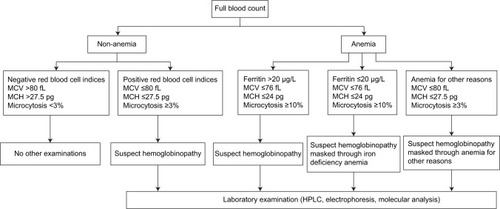
Figure 2 The algorithm of targeted antenatal nonsickling hemoglobinopathy screening.