
Figures & data
Figure 1 Conceptual framework of the systemic, household, and individual factors that impact attendance at birth.
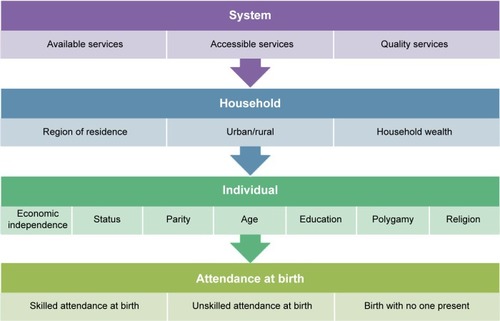
Table 1 Variables used in the analysis
Table 2 Weighted distribution of the analysis variables, by survey year, among married Nigerian women who had given birth in the 5 years preceding the survey
Figure 2 Percentage of married Nigerian women (who had given birth in the five years preceding the survey) who gave birth with no one present, by region.
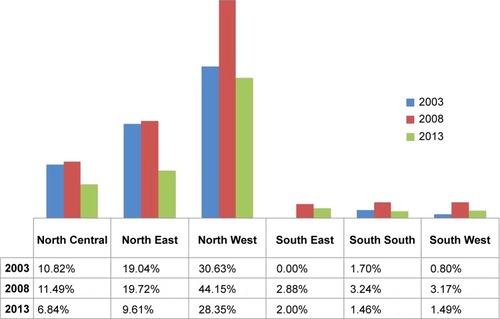
Table 3 Trends in the percentage of married women, who had given birth in the 5 years preceding survey, who gave birth alone
Table 4 Unadjusted odds ratios, by survey year, predicting married Nigerian women’s most recent birth (among women who had given birth in the 5 years preceding the survey) occurring with no one presentTable Footnotea
Table 5 Adjusted odds ratios, by survey year, predicting married Nigerian women’s most recent birth (among women who had given birth in the 5 years preceding the survey) occurring with no one presentTable Footnotea
Table 6 Distribution of where most recent birth occurred by region, in married women with at least one birth in the years preceding the survey
Table 7 Percentage of women who took iron tablets or syrup in zones, in 2003–2013, and prevalence of women giving birth with NOP, prevalence by region