
Figures & data
Figure 1 Annual cesarean delivery rate over a 10-year period 2002–2011 at EBSUTH.
Abbreviation: EBSUTH, Ebonyi State University Teaching Hospital.
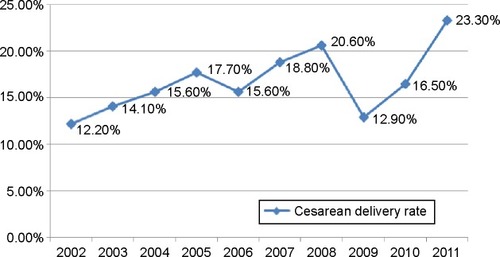
Table 1 Trend of cesarean delivery over a 10-year period 2002–2011 at EBSUTH
Table 2 Main characteristics of 2,097 cases of cesarean delivery performed at EBSUTH over a 10-year period (2002–2011)
Table 3 The indications for the cesarean deliveries in 2,097 cases delivered at EBSUTH over a 10-year period (2002–2011)Table Footnotea
Table 4 Outcome of 2,097 cesarean deliveries performed over a 10-year period (2002–2011) at EBSUTH
Table 5 Intraoperative blood loss, frequency of blood transfusion, maternal case fatality, and causes of maternal death among mothers delivered by cesarean delivery over a 10-year period 2002–2011 at EBSUTH