
Figures & data
Table 1 Baseline characteristic of participants
Table 2 Characteristics of participants according to menopausal status (n=119)
Table 3 Prevalence of menopausal symptoms according to Menopause Rating Scale (n=119)
Table 4 Prevalence of menopausal symptoms according to menopausal status (n=119)
Table 5 Mean scores of MRS according to menopausal status
Figure 1 Quality-of-life changes with aging.
Abbreviation: MRS, Menopause Rating Scale.
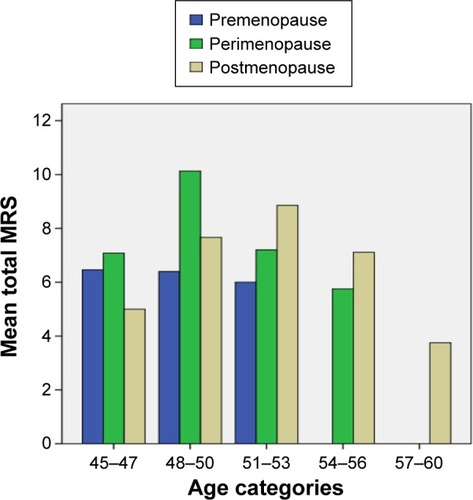
Table 6 Relationship between smoking and exercise and MRS quality-of-life score
Table 7 Effect of BMI on MRS quality-of-life scores