
Figures & data
Table 1 Relevant German ICPM codes for establishing the case and control groups
Figure 1 Distribution of propensity scores prior to matching.
Abbreviation: KS test, Kolmogorov–Smirnov test.
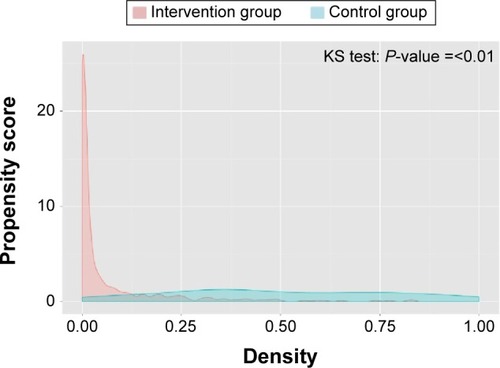
Figure 2 Distribution of propensity scores after matching.
Abbreviation: KS test, Kolmogorov–Smirnov test.
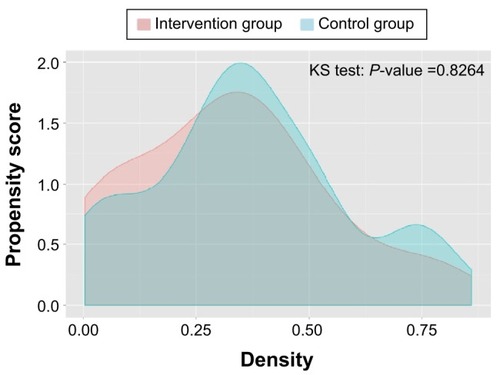
Table 2 Average total direct costs (€) per patient during quarter of treatment and 2-year follow-up