Figures & data
Table 1 Comparison of key reproductive health outcomes, baseline 2009 to end line 2013, PRRINN-MNCH States of Katsina, Yobe, and Zamfara
Table 2 Calculation of the average cost per community supporting Community Communication Emergency Referrals, PRRINN-MNCH, July 2012
Table 3 Calculating the TC faced by women throughout the maternal state as a percent of TB
Table 4 Calculation of the estimated percent of the TC that are delivery-associated complications occurring during the period mothers are expected to be under the care of an SBA (DAC)
Table 5 Calculation of the estimated percent of DACB along with expected PRRINN-MNCH delivery-associated complications
Figure 1 Comparison of estimated lives saved by the SBA delivery strategy and lives saved by CCER strategy over 4 years in the PRRINN-MNCH intervention sites.
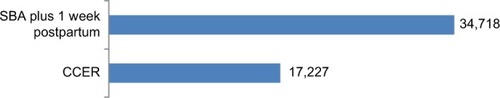
Table 6 Key maternal, newborn, and child knowledge among respondents at baseline and end line, PRRINN-MNCH Knowledge, Attitude, and Practices Survey
Table 7 Self-reported behavior change – plans made for a maternal emergency (%)
Figure 2 The lifesaving chain of events established by CCER.
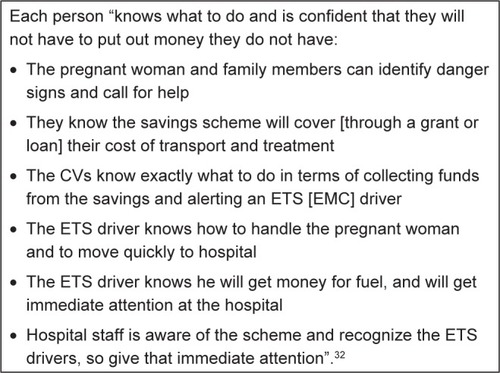
Figure 3 Case study 11, Latifa, aged 18 years.