Figures & data
Figure 1 Grape growth (A) and juice composition (B) components at harvest.
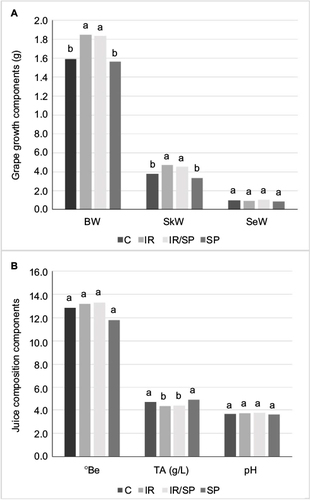
Table 1 Irrigation (I) and yeast application (Y) effects on grape growth components measured at harvest
Table 2 Irrigation (I) and yeast application (Y) effects on phenolic potential of grapes
Figure 2 Phenolic potential of grapes at harvest.
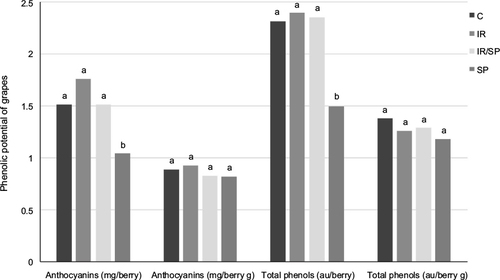
Figure 3 Anthocyanin concentration (mg/g skin fresh weight) of Agiorgitiko grape skin at ripeness stage.
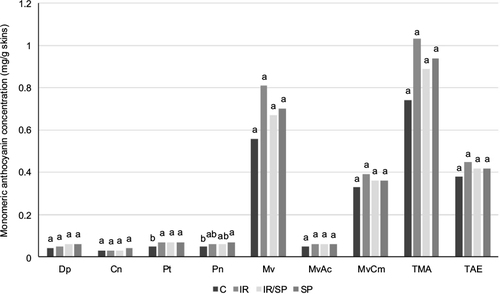
Table 3 Irrigation (I) and yeast application (Y) effects on anthocyanin concentration (mg/g skin fresh weight) of Agiorgitiko grape skin at ripeness stage
Table 4 Irrigation (I) and yeast application (Y) effects on phenolic composition of Agiorgitiko grape skin and seeds at harvest
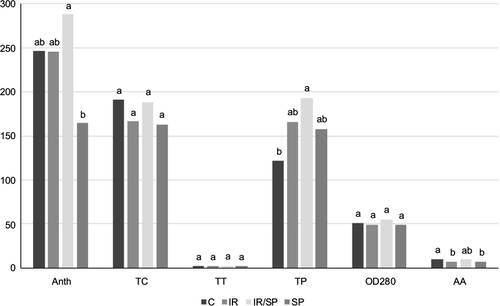
Figure 4 Phenolic composition of Agiorgitiko grape skin and seed at harvest: skin and seed tannins and phenols (A) and skin and seed antioxidant activity (B).
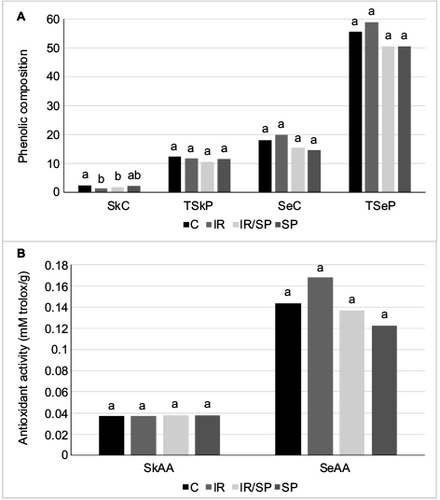
Table 5 Irrigation (I) and yeast application (Y) effects on alcohol content, TA, pH, and color properties of the produced wines
Figure 5 Alcohol content (% v/v), TA (g/L), pH, and color properties of the produced wines.
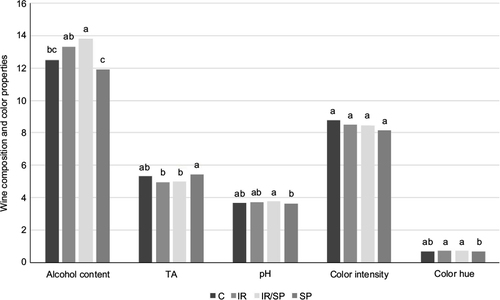
Table 6 Irrigation (I) and yeast application (Y) effects on anthocyanin concentration of the produced wines
Figure 6 Anthocyanin concentration of the produced wines.
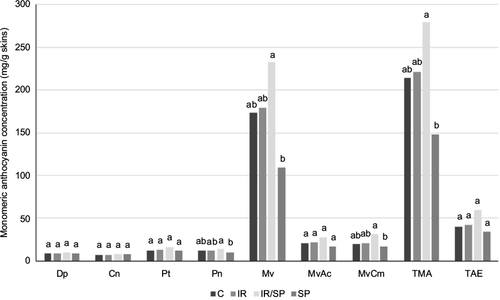
Table 7 Irrigation (I) and yeast application (Y) effects on phenolic composition of the produced wines
Figure 7 Phenolic composition of the produced wines.