Figures & data
Table 1 List of South American wines according to their variety, origin, vintage, and altitude
Table 2 Antioxidant capacity determined by ABTS and FRAP methods, TPH, TF, and trans-resveratrol in South American red wines
Figure 1 HPLC chromatogram for the trans-resveratrol identification comparing Campos del Solana and Cabenet Sauvignon 2012 (BW11) red (red line) wine sample and the trans-resveratrol standard 20 ppm (blue line).
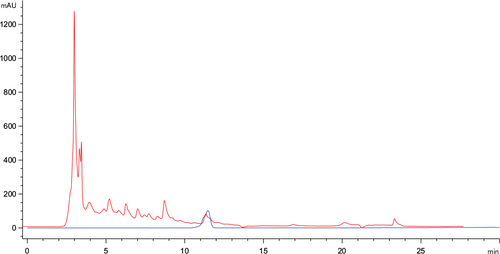
Figure 2 HPLC UV spectra for the (A) trans-resveratrol standard of 20 ppm and (B) red wine sample (BW11) identification.
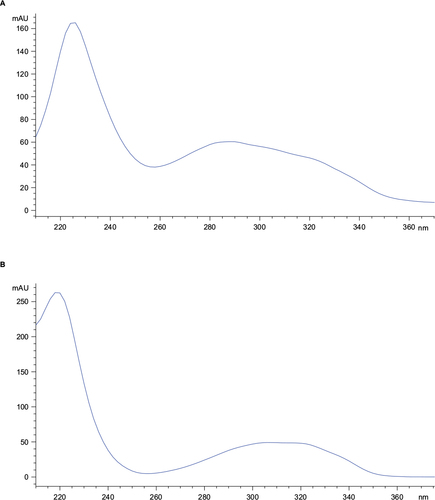
Figure 3 Pearson correlation coefficients between ABTS and FRAP.
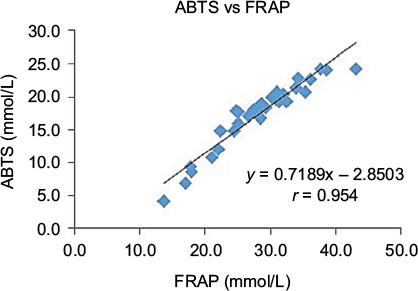
Figure 4 HPLC chromatogram for the sample (AW1) showing the comparison among the peaks with saccharose, glucose, and fructose standard (0.5 g/L).
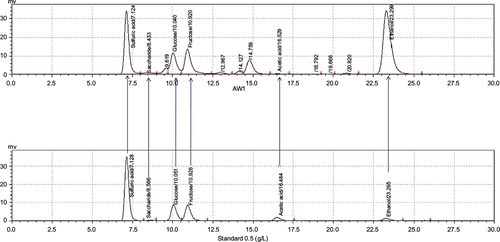
Table 3 Saccharides concentrations in the different wines studied
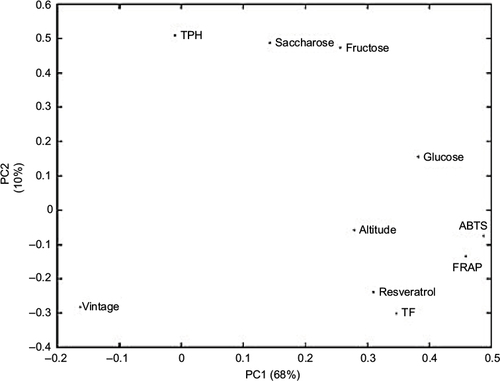
Figure 5 PCA plot representing all the parameters in the study, including countries, vintage, TAC, trans-resveratrol, TPH, TF, main saccharides, grape varieties, and altitude.
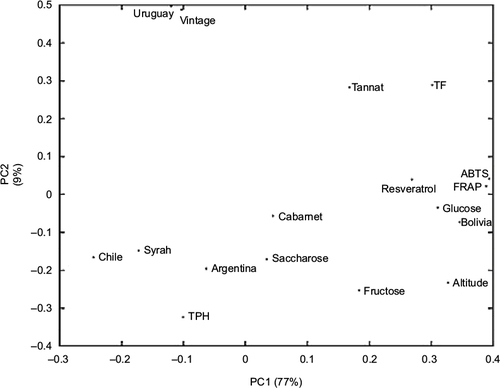
Figure 6 PCA plot representing the following parameters in the study: vintage, TAC, trans-resveratrol, TPH, TF, main saccharides, and altitude.