Figures & data
Figure 1 PCV secondary to a stable choroidal nevus.
Notes: Arrows point to the PCV lesion in (A)–(C). Green triangles outline the nevus lesion in (A), (B), and (D). (A) Color fundus photography shows a pigmented choroidal nevus lesion with overlying clumped soft drusen. (B) Fluorescein angiogram shows a polypoidal lesion at the nasal edge adjacent to the choroidal nevus with early filling of the polypoidal lesion after dye injection (20 seconds). (C) Hyperfluorescence in the late phase (3 minutes); dotted line shows the OCT cross-sectional slice. (D) OCT reveals extensive SRF and a retinal PED with underlying polypoidal lesion. Following PDT, OCT shows (E) reduced SRF at 2 weeks and (F) an absence of SRF at 2 months.
Abbreviations: PCV, polypoidal choroidal vasculopathy; OCT, optical coherence tomography; SRF, subretinal fluid; PED, pigment epithelium detachment; PDT, photodynamic therapy.
Abbreviations: PCV, polypoidal choroidal vasculopathy; OCT, optical coherence tomography; SRF, subretinal fluid; PED, pigment epithelium detachment; PDT, photodynamic therapy.
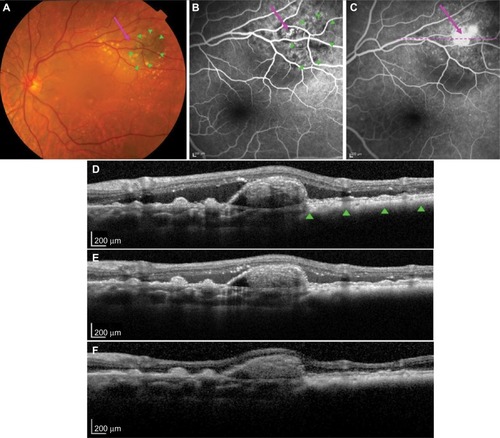
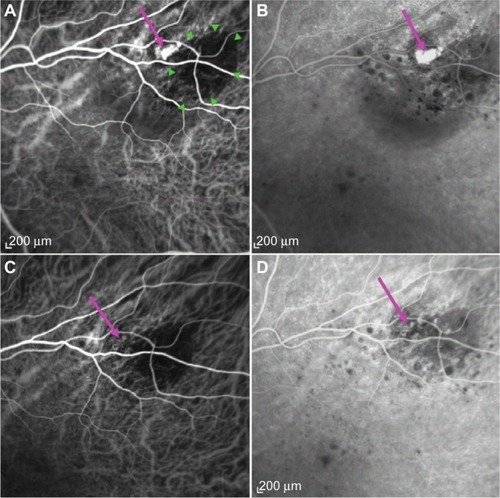
Figure 2 Regression of polyp after PDT laser.
Notes: ICGA shows a choroidal nevus (green triangles in A) and a grape-like polypoidal lesion (arrows in A–D) with small BVN located at the nasal edge adjacent to the nevus lesion. (A) Hypercyanescence of the polypoidal lesion was observed in ICGA in the early phase (30 seconds) and (B) in the late phase (6 minutes). Following PDT, ICGA reveals (C) an involuted polypoidal lesion with feeder vessel and BVN in the early phase (30 seconds) and (D) an absence of hypercyanescence in the late phase (10 minutes).
Abbreviations: ICGA, indocyanine green angiography; PDT, photodynamic therapy; BVN, branching vascular network.
Abbreviations: ICGA, indocyanine green angiography; PDT, photodynamic therapy; BVN, branching vascular network.