Figures & data
Figure 1 (A) Videonystagmogram shows no horizontal nystagmus component. (B) Horizontal saccades show hypermetric saccades to the right (arrows).
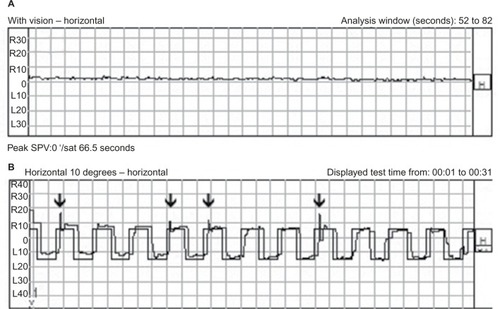
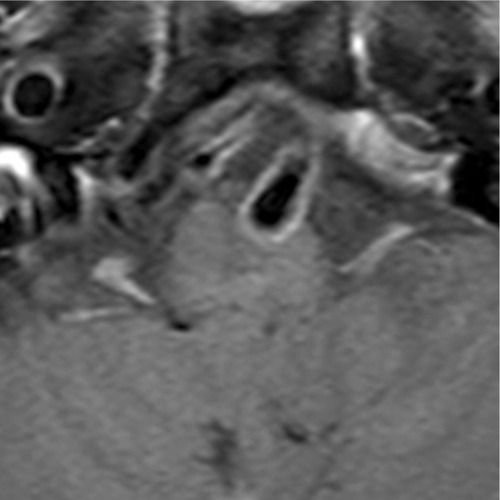
Figure 2 MRI of the brain. Thin slice axial T2-weighted with fat suppression shows dolichoectatic left vertebral artery exerting a pressure effect to the left medulla with a hypersignal T2 change at left medulla (arrow).
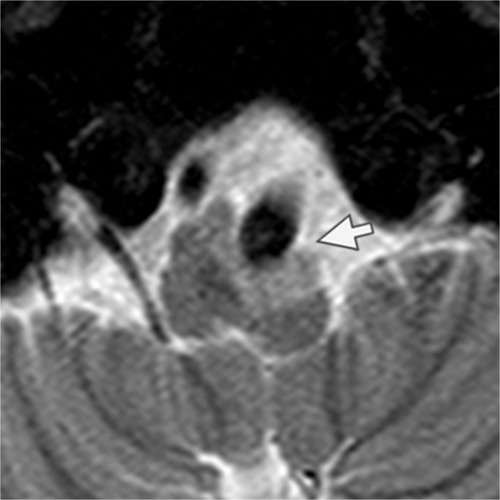
Figure 3 MRI of the brain. ADC image shows increased diffusion at the left medulla (arrow).
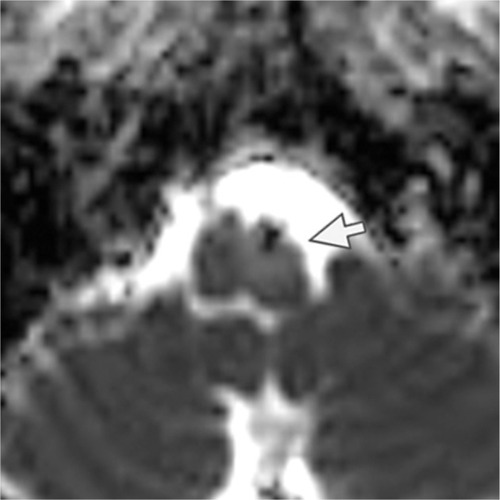
Figure 4 MRI of the brain. DWI shows no restricted diffusion at the left medulla which correlates to increased diffusion in ADC.
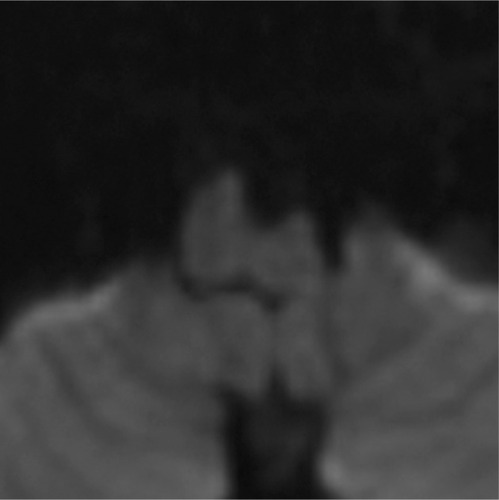
Figure 5 3D TOF MRA of the posterior circulation reveals dolichoectatic left vertebral artery with redundancy to the right (arrow).
Abbreviations: 3D, three dimensional; MRA, magnetic resonance angiogram; TOF, time of flight.
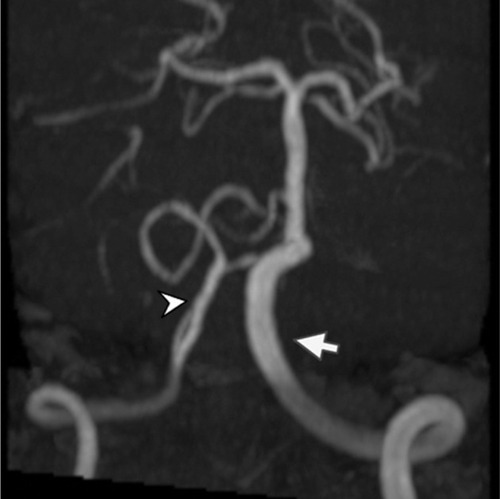
Figure 6 MRI of the brain. Thin slice axial T1-weighted with gadolinium injection and fat suppression shows no gadolinium enhancement on compressed left medulla.