Figures & data
Figure 1 Blue sclera.
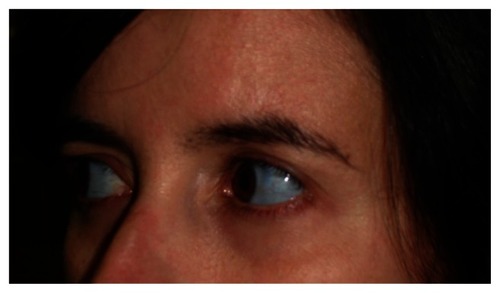
Figure 2 Lumbar spine X-ray (A) and computed tomography scan (B, sagittal view and C, axial view) of the spine showing diffuse low bone density.
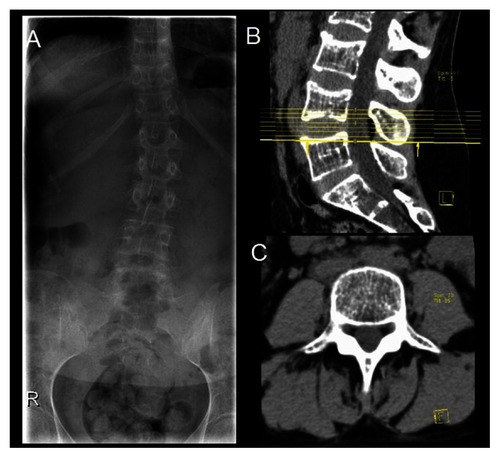
Figure 3 Bone scintigraphy (A, anterior view, B, posterior view) showing increased uptake in the 7th, 8th and 9th right ribs (arrows).
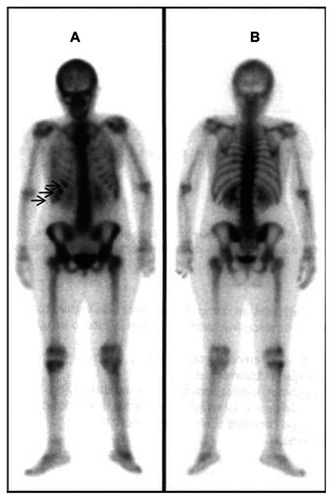
Table 2 Dual-energy X-ray absorptiometry results revealing an increase of bone mineral density (BMD) of the lumbar spine in the 3 years after treatment with alendronate