Figures & data
Figure 1 There is the characteristic ST-segment elevation ≥2 mm in ≥1 right precordial lead (V1 to V3), followed by an r'-wave and a straight ST-segment.
Notes: Additionally, the descending ST-segment crosses the isoelectric line and is followed by a negative and symmetric T-wave. At 40 ms of high takeoff, the decrease in amplitude of ST is ≤4 mm, the duration of QRS is longer than in a right bundle branch block and there is a mismatch between V1 and V6 ()Citation3. No high-pass filters were applied to attenuate low-frequency noise.Citation14,Citation15
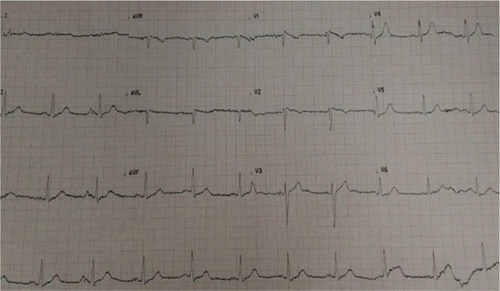
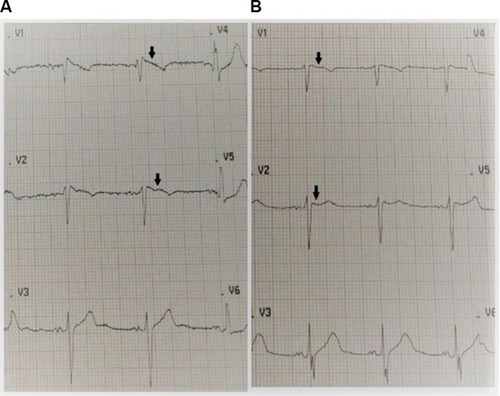
Figure 2 (A) Admission ECG upon presentation indicating a coved ST-segment elevation (black arrows) in V1 and V2, with elevated J points suggestive of a Brugada type 1 pattern. The patient’s serum sodium was 108 mg/dL (normal 135–145 mg/dL). (B) Day 5 ECG indicating resolution of the Brugada type 1 pattern (black arrows) with normalization of serum sodium. The patient’s serum sodium was 135 mg/dL (normal 135–145 mg/dL).
Abbreviation: ECG, electrocardiogram.